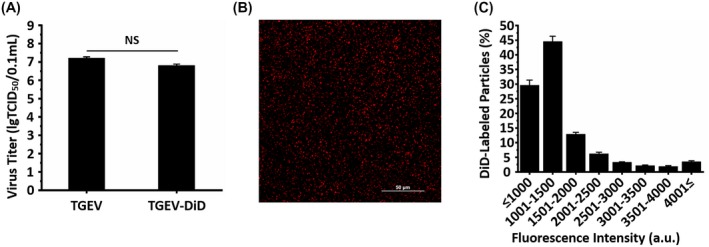
Figure 1.

Performances of DiD‐labeled TGEVs. A, Virus titers of unlabeled and DiD‐labeled TGEVs. Data represent the results of three independent experiments implemented in triplicates. NS, nonsignificant. B, Representative image showing DiD‐labeled TGEVs visualized by fluorescence microscopy using a 647‐nm laser. Scale bar, 50 μm. C, Fluorescence intensity histogram of 198 062 individual DiD‐labeled TGEVs. The fluorescence intensity was analyzed using the NIS‐Elements software. a.u., arbitrary units. All graphs show mean ± SD
