
Figure 6.
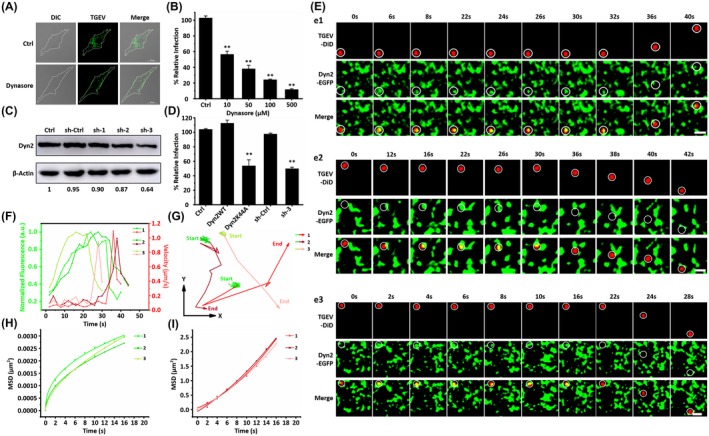
Dynamin 2 promotes TGEV internalization. A, Representative immunofluorescence images of TGEVs in control and dynasore‐treated cells. The ST cells were treated or untreated with 100 μM dynasore for 30 min and subsequently inoculated with TGEVs for 2 h, and then the ST cells were fixed and the infected TGEVs were stained with the anti‐TGEV primary antibody and the fluorescent secondary antibody. Scale bar, 20 μm. B, Effects of dynasore with different concentrations on TGEV infection. The ST cells were treated or untreated with the indicated concentrations of dynasore for 30 min and inoculated with TGEVs for 2 h, subsequently, the relative TGEV levels were measured by qPCR. Data present as mean ± SD from three independent experiments. **P < .01 by t test. C, Analysis on the expression of Dyn2 in the ST cells transfected with shRNAs. The ST cells were transfected with shRNAs for 24 h and subsequently lysed and collected to measure the expression level of Dyn2 by western blot. D, Effects of Dyn2WT, Dyn2K44A, sh‐ctrl, and sh‐3 on TGEV infection. The ST cells were transfected with corresponding plasmids and shRNAs for 24 h and inoculated with TGEVs for 2 h, subsequently, the relative TGEV levels were measured by qPCR. Data present as mean ± SD from three independent experiments. **P < .01 by t test. E, Time‐lapse images of the internalization of three TGEVs through Dyn2‐dependent pathway shown in Videos S10‐S12. Circles indicate the positions of the TGEVs in each panel. Scale bar, 2 μm. F, Fluorescence intensity curves of Dyn2 at the site of virus and velocity curves of viral diffusion corresponding to (E). G, Trajectories of viral diffusion corresponding to (E). H and I, MSD vs time plots of viral movement. The colors are in accordance with those in (G)