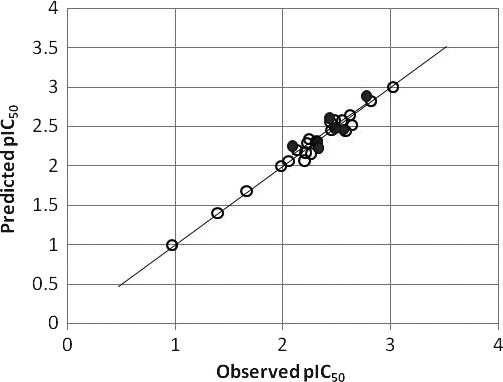
Figure 7.

Scatterplots of the comparative molecular field analysis (CoMFA) predicted and observed values of HL‐60 inhibitory activities for molecules in CoMFA model. ○: training set; •: test set.

Scatterplots of the comparative molecular field analysis (CoMFA) predicted and observed values of HL‐60 inhibitory activities for molecules in CoMFA model. ○: training set; •: test set.