
Figure 1.
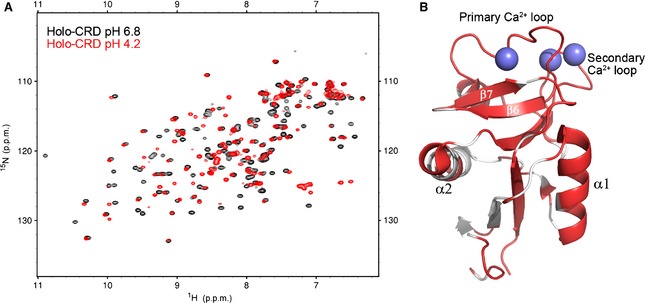
Chemical shift changes of the holo‐CRD upon reduction of the pH. (A) HSQC spectra of the holo‐CRD at pH 6.8 (black) and pH 4.2 (red). Decreasing the pH of the holo‐CRD sample caused chemical shift perturbations for ~ 80% of peaks, and variations in intensity throughout the HSQC spectrum, indicating that significant conformational and/or dynamic changes had occurred. (B) The residues whose chemical shifts remained unchanged upon reduction of the pH are mapped onto the crystal structure of the DC‐SIGNR CRD (PDB ID http://www.rcsb.org/pdb/search/structidSearch.do?structureId=1K9J) and are shown in white. The regions of the structure shown in red, including all residues in both Ca2+‐binding loops (calcium ions are represented by spheres), α‐helix 1, and β‐sheets 6 and 7, undergo clear chemical shift changes upon reduction of the pH.