
Figure 2.
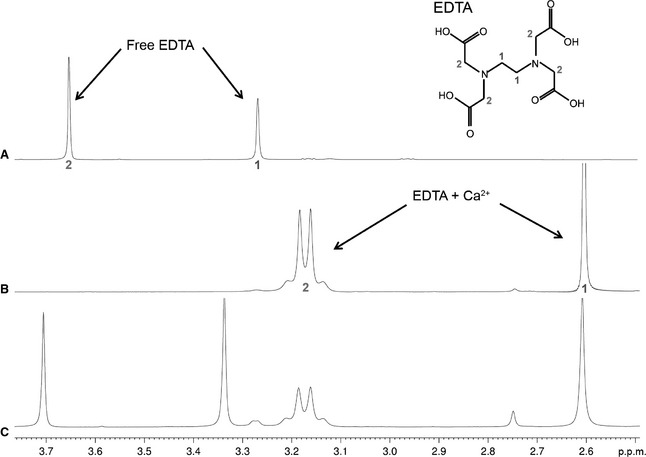
1D 1H‐spectra obtained with (A) addition of EDTA to the apo‐CRD, (B) addition of EDTA to the holo‐CRD, and (C) addition of excess EDTA to the holo‐CRD. All spectra were recorded at pH 6.8. EDTA can be used to probe for the presence of Ca2+, as the 1D spectra of free and Ca2+‐bound EDTA are easily identified. Assignments are mapped onto the EDTA structure, and the pH was kept constant for all spectra. Addition of EDTA to the apo‐CRD (A) produced only free EDTA peaks, confirming that there was no Ca2+ present, and that the protein was indeed in the apo‐form. In contrast, addition of EDTA to the holo‐CRD (B) produced only Ca2+‐bound EDTA peaks, as the free Ca2+ interacts with EDTA. Addition of excess EDTA to the holo‐CRD (C) resulted in the appearance of additional free EDTA peaks.