
Figure 4.
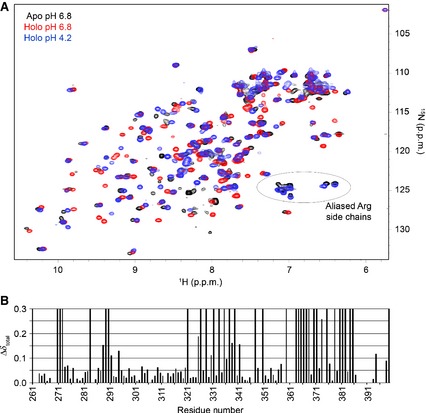
(A) HSQC spectra of the apo‐CRD at pH 6.8 (black), the holo‐CRD at pH 6.8 (red), and the holo‐CRD at pH 4.2 (blue). It is clear from the HSQC spectra that substantial chemical shift perturbations occurred throughout the CRD upon binding of Ca2+ (i.e. upon addition of 4 mm Ca2+). In addition, the spectrum of the apo‐CRD is broader than that of the holo‐CRD, suggesting a change in dynamics upon Ca2+ binding. Comparison of the HSQC spectra of the apo‐CRD at pH 6.8 and the holo‐CRD at pH 4.2 indicates that reduction of the pH does not generate the Ca2+‐free, apo form, but instead produces an additional, distinct species that may represent a ‘Ca2+‐depleted’ form or multiple species. These two spectra do show a similar pattern of peaks (circled) that we have interpreted to be aliased arginine side chain peaks in very similar chemical environments. (B) Total chemical shift perturbation per residue (Δδtotal; see Experimental procedures) observed upon removal of Ca2+ (comparing apo‐CRD and holo‐CRD 1H and 15N chemical shifts) at pH 6.8. Peaks that have moved/broadened so significantly as to prevent their assignment in the apo‐CRD spectrum are represented with a maximum perturbation of 0.3.