
Figure 7.
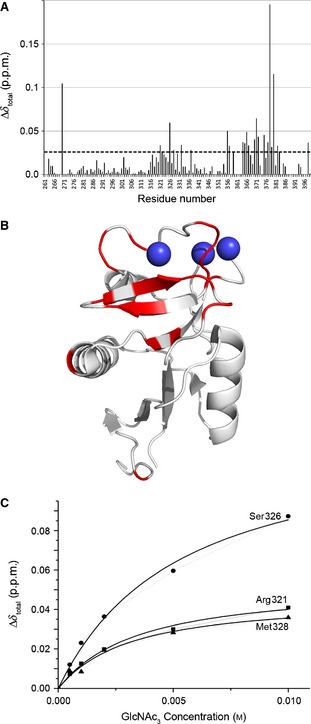
Chemical shift perturbation upon binding of GlcNAc3 to the CRD. (A) Total chemical shift perturbation per residue (Δδtotal) upon addition of GlcNAc3 was calculated from Eqn (1) in Experimental procedures. The dashed horizontal line represents the 1 × standard deviation cut‐off for the dataset, above which a change was considered to be significant. (B) Chemical shift perturbations upon binding of GlcNAc3 mapped onto the CRD crystal structure. Residues showing chemical shift perturbations above the 1 × standard deviation cut‐off (see dashed line) are shown in red on the CRD crystal structure (PDB ID http://www.rcsb.org/pdb/search/structidSearch.do?structureId=1K9J). These agree well with the regions of the CRD that responded most strongly to binding of the small glycans (Man3, Man5, and GlcNAc2Man3) previously reported, namely α‐helix 2, β‐strands 6 and 7, and both Ca2+‐binding loops. (C) The total chemical shift perturbation per residue (Δδtotal) is plotted against glycan concentration, and fitted to a single‐site binding model. All significantly perturbed residues fit the same single‐site model, but here only three residues in α‐helix 2 (a proposed binding site for small glycan fragments) are shown as an illustration. The fit was used to calculate the dissociation constant of the CRD for GlcNAc3.