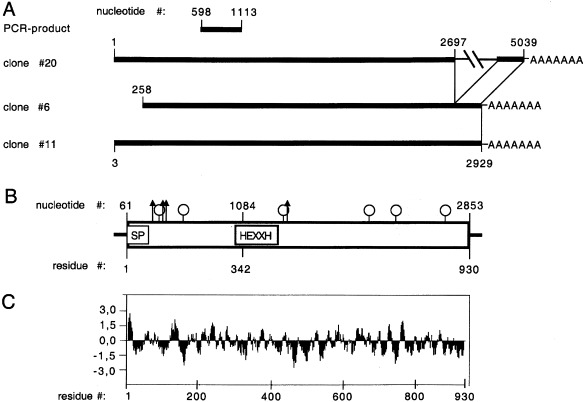
Figure 1.

Schematic illustration of the cDNA cloning strategy, the major transcript and the deduced protein. (A) Summary of the relative positions of the PCR product and the cDNA clones. Numbers correspond to the composite cDNA. The inserted sequence of clone 20 and the poly(A) tail are indicated. (B) Schematic structure of the major transcript and the deduced protein. Horizontal lines indicate the 5′ UTR and the 3′ UTR. The open box represents the ORF; SP indicates the potential signal peptide, and HEXXH the Zn‐binding motif. Arrows and lollipops indicate the positions of predicted O‐glycosylation and N‐glycosylation sites, respectively. (C) Hydrophobicity profile of the deduced protein.
