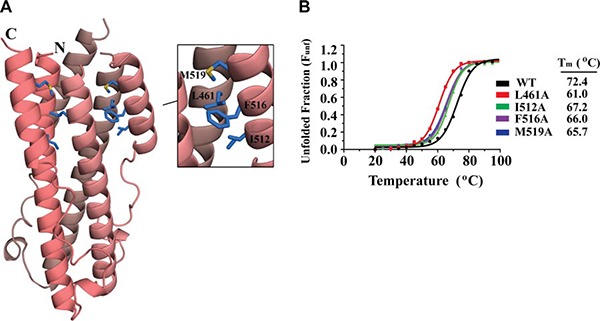
Figure 4.

ASLV TM hydrophobic interactions. A) Ribbon diagram of ASLV TM with hydrophobic interactions between the HR1‐HR2 regions. Each TM monomer is shown in a different shade of pink. Inset: zoomed view of the hydrophobic interactions (blue sticks). B) CD thermal denaturation profiles of wild‐type and hydrophobic ASLV TM mutants. CD signals were all normalized between 0 (folded) and 1 (unfolded); melting temperatures are shown at right.
