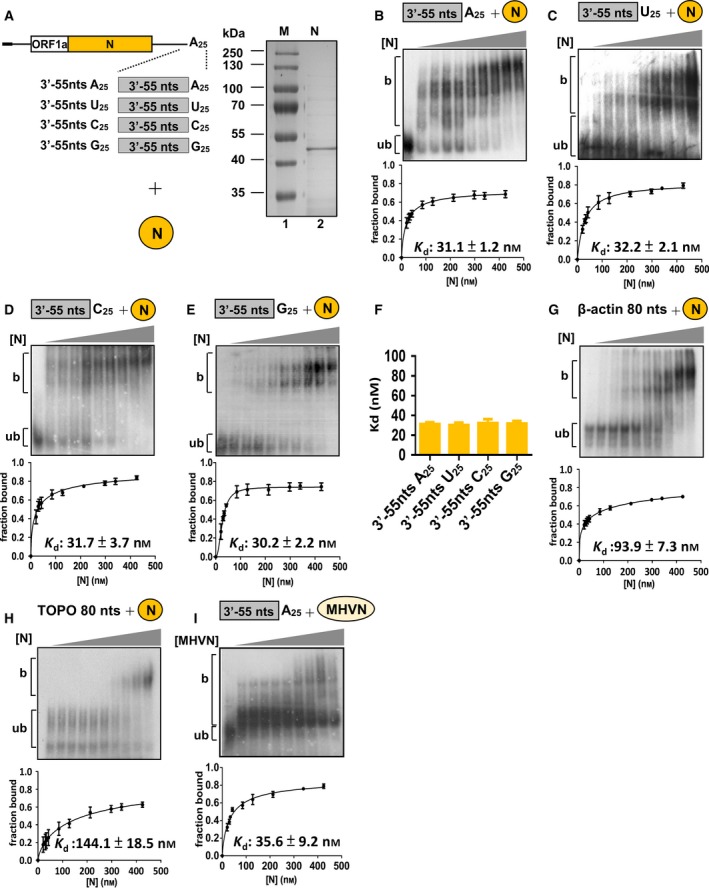
Figure 2.

Determination of binding affinity between N protein and RNA elements by Kd. (A) Schematic diagrams depicting the structure of RNA probes (left panel) and E. coli‐expressed BCoV N protein (right panel) for determination of N protein‐binding affinities. (B–E) Upper panel: EMSA showing binding experiments using a fixed concentration of 0.2 nm 32P‐labeled RNA probe with increasing amount of N protein. Lower panel: a plot of a fraction of bound RNA against protein concentration based on the EMSA results shown in the upper panel, which was used for Kd determination using the Hill equation. (F) Kd values for the RNA probes shown in (A) with N protein. (G and H) Determination of Kd for RNA probes derived from the 3′‐terminus of the β‐actin mRNA and TOPO‐XL plasmid, respectively, using the same methods described for (B–E). (I) Determination of the bonding affinity between MHV N protein and RNA probe containing the CoV 3′‐terminal 55 nt plus a 25‐nt poly(A) tail by EMSA and Kd. The values in (B–I) represent the mean ± SD (n = 3) of three independent experiments. b, protein‐bound RNA; ub, unbound RNA.
