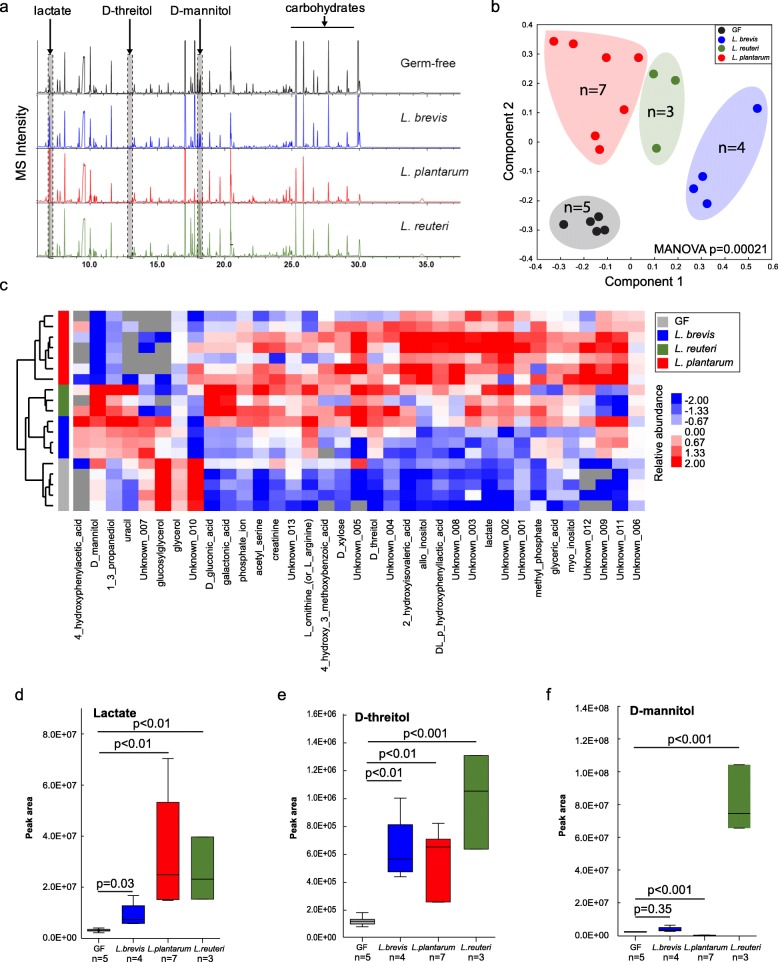
Fig. 3.
Metabolomics analysis of fecal samples from Lactobacillus-colonized and germ-free mice. a Representative GC–MS chromatograms of metabolite profiles in germ-free and Lactobacillus-colonized mouse fecal samples. Each chromatogram is a representative mass spectrometry profile from one cage of mice (4 mice/cage). b PCoA of metabolite profiles were measured in fecal samples. c Heatmap of metabolites differentiated between Lactobacillus-colonized and germ-free mice. d–f Relative abundance of select metabolites in fecal samples from individual mice. Error bars indicate mean ± SEM

