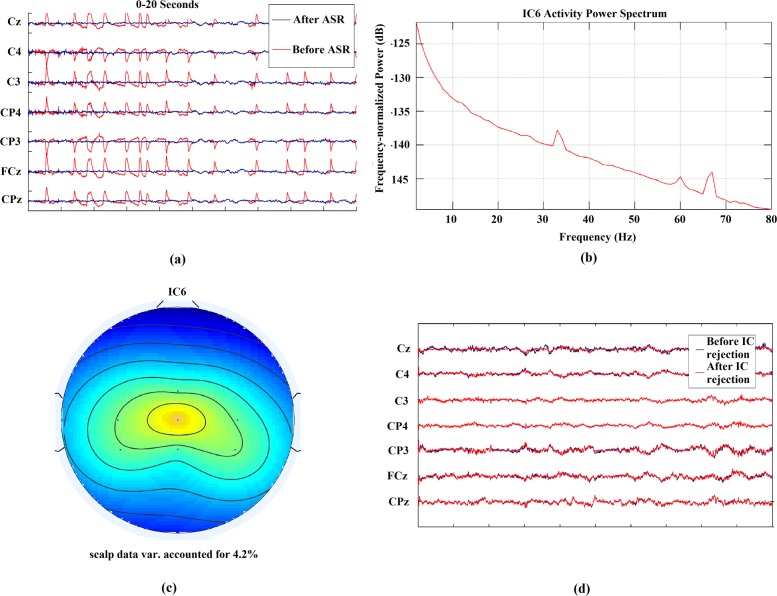
Fig. 2.
The cleaning process of EEG data from subject 5. a Shows the performance of ASR in removing eye movement artifacts and unnatural high amplitude noise. Moreover, channel Pz was marked as a flat channel and was rejected by the algorithm. b and c shows the power spectrum and scalp distribution of a rejected Independent Component. The IC was rejected due to its low contribution to the scalp data variance and unusual peaks at higher frequencies like 60 and 70 Hz. d shows the EEG signal obtained after ASR operation and artifactual IC rejection

