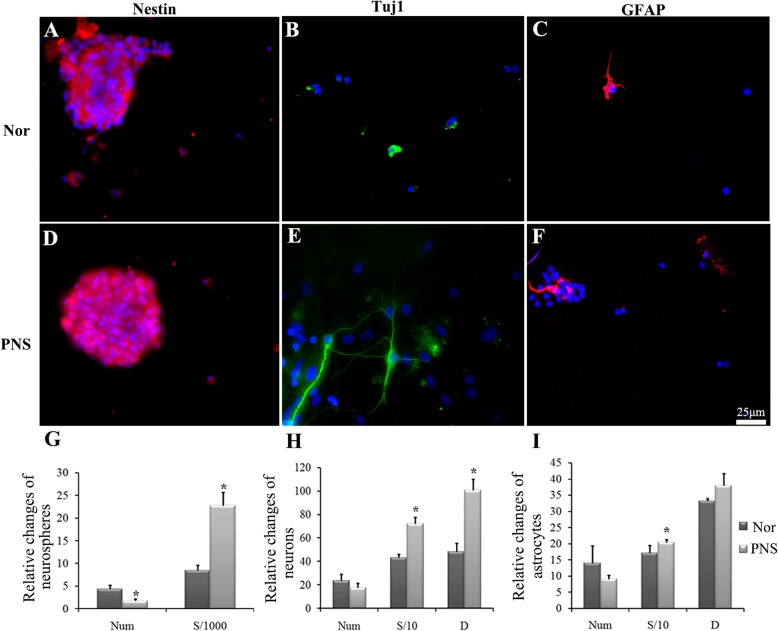
Fig. 2.
The proliferation and differentiation of the cultured NSCs in the normal and PNS groups. a–d, b–e, c–f The immunofluorescent staining of nestin (red immunofluorescence), Tuj1 (green immunofluorescence), and GFAP (red immunofluorescence) in the normal and PNS group, respectively. DAPI was used to stain the cell nucleus (blue). Scale bar, 25 μm. g–i The representative bar graphs of proliferation and differentiation of NSCs or its differentiated states in the normal and PNS groups. Data were presented as means ± SD. Each group contained 5 samples. *P < 0.05 versus Nor group. Nor, normal group; PNS, Panax notoginseng saponins group; Num, the number of the cells/neuronspheres; S, cell area. S/1000, S/10represents the area value divided 1000 and 10, respectively; D, the length of the synapse

