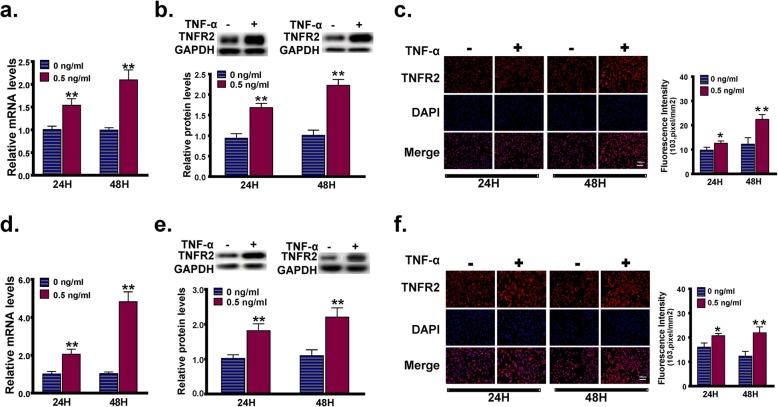
Fig. 2.
The effect of a low concentration of TNF-α on the expression of TNFR2 in MC3T3-E1 cells. a-c MC3T3-E1 cells were treated with or without 0.5 ng/ml TNF-α in the regular culture medium for 24 h or 48 h, and the Tnfr2 expression level was determined using RT-PCR (a), western blot (b) and immunofluorescence staining for TNFR2 (c). d-f MC3T3-E1 cells were cultured in the osteogenic induction medium supplemented with or without 0.5 ng/ml TNF-α for 24 h or 48 h, and the Tnfr2 expression level was determined using RT-PCR (d), western blot (e) and immunofluorescence staining for TNFR2 (f). *, p < 0.05 vs. the 0 ng/ml group; **, p < 0.01 vs. the 0 ng/ml groupg

