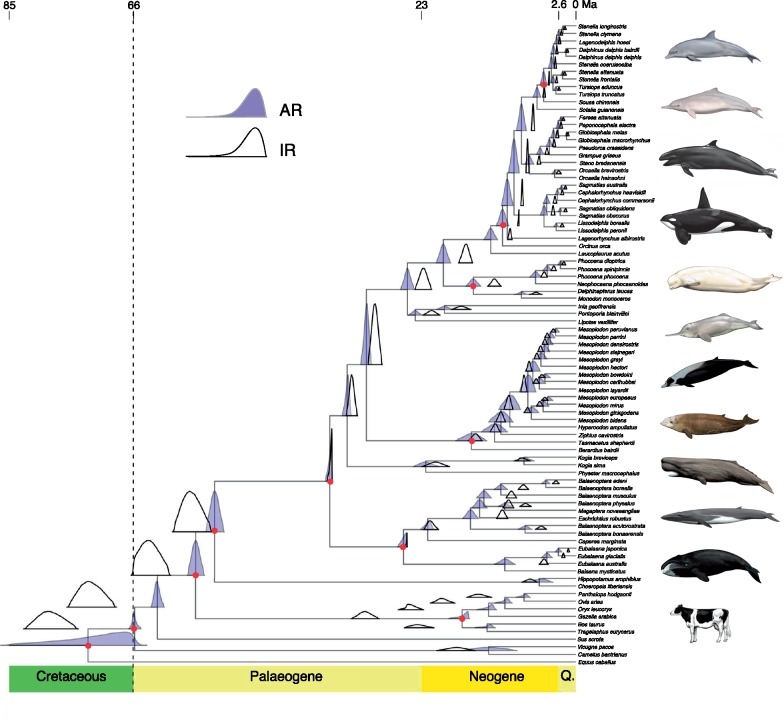
Figure 3.
Timetree of Cetacea analyzed in the MCMCTree package of PAML 4.9h using six partitions and approximate likelihood (Yang 2007). A time scale in Ma (millions of years) is shown above the tree, with geologic periods labeled below the tree for reference (Q = Quaternary). Above each node the posterior distributions of the AR model (purple) and IR model (white) are shown. Raw numbers for the mean and 95% confidence intervals for each node and each model are shown in Supplementary Table S3 available on Dryad. Red circles at each node represent calibration points listed in Table 2. Illustrations are by Carl Buell and represent (top to bottom) T. truncatus (common bottlenose dolphin), Sousa chinensis (Indo-Pacific humpback dolphin), F. attenuata (pygmy killer whale), O. orca (killer whale), Delphinapterus leucas (beluga), L. vexillifer (Yangtze river dolphin), Mesoplodon layardii (strap-toothed whale), Ziphius cavirostris (Cuvier’s beaked whale), P. macrocephalus (sperm whale), B. physalus (fin whale), B. mysticetus (bowhead whale), and B. taurus (domestic cow). This tree with posterior node estimates was generated with the mcmc.tree.plot function from the R package MCMCtreeR (Puttick 2019).

