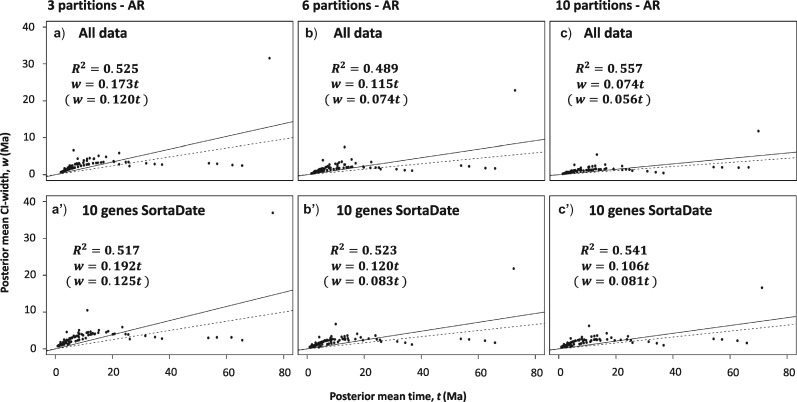
Figure 5.
Infinite-sites plots showing the estimated posterior mean times in Ma ( -axis) plotted against the estimated posterior confidence interval (CI) widths in Ma (
 -axis) for the AR model for both data sets (all data, 10 genes SortaDate) using the three different partition schemes, three partitions (a, a’), six partitions (b, b’), and 10 partitions (c, c’). The solid line represents the regression line including the root and the dotted line represents the regression line excluding the root.
  is the coefficient of determination for each comparison, whereas below each are the equations of the regression lines with and without the root.

