
Figure 1. Iron Supplementation Restores Mitochondrial Function in V-ATPase Deficient Cells.
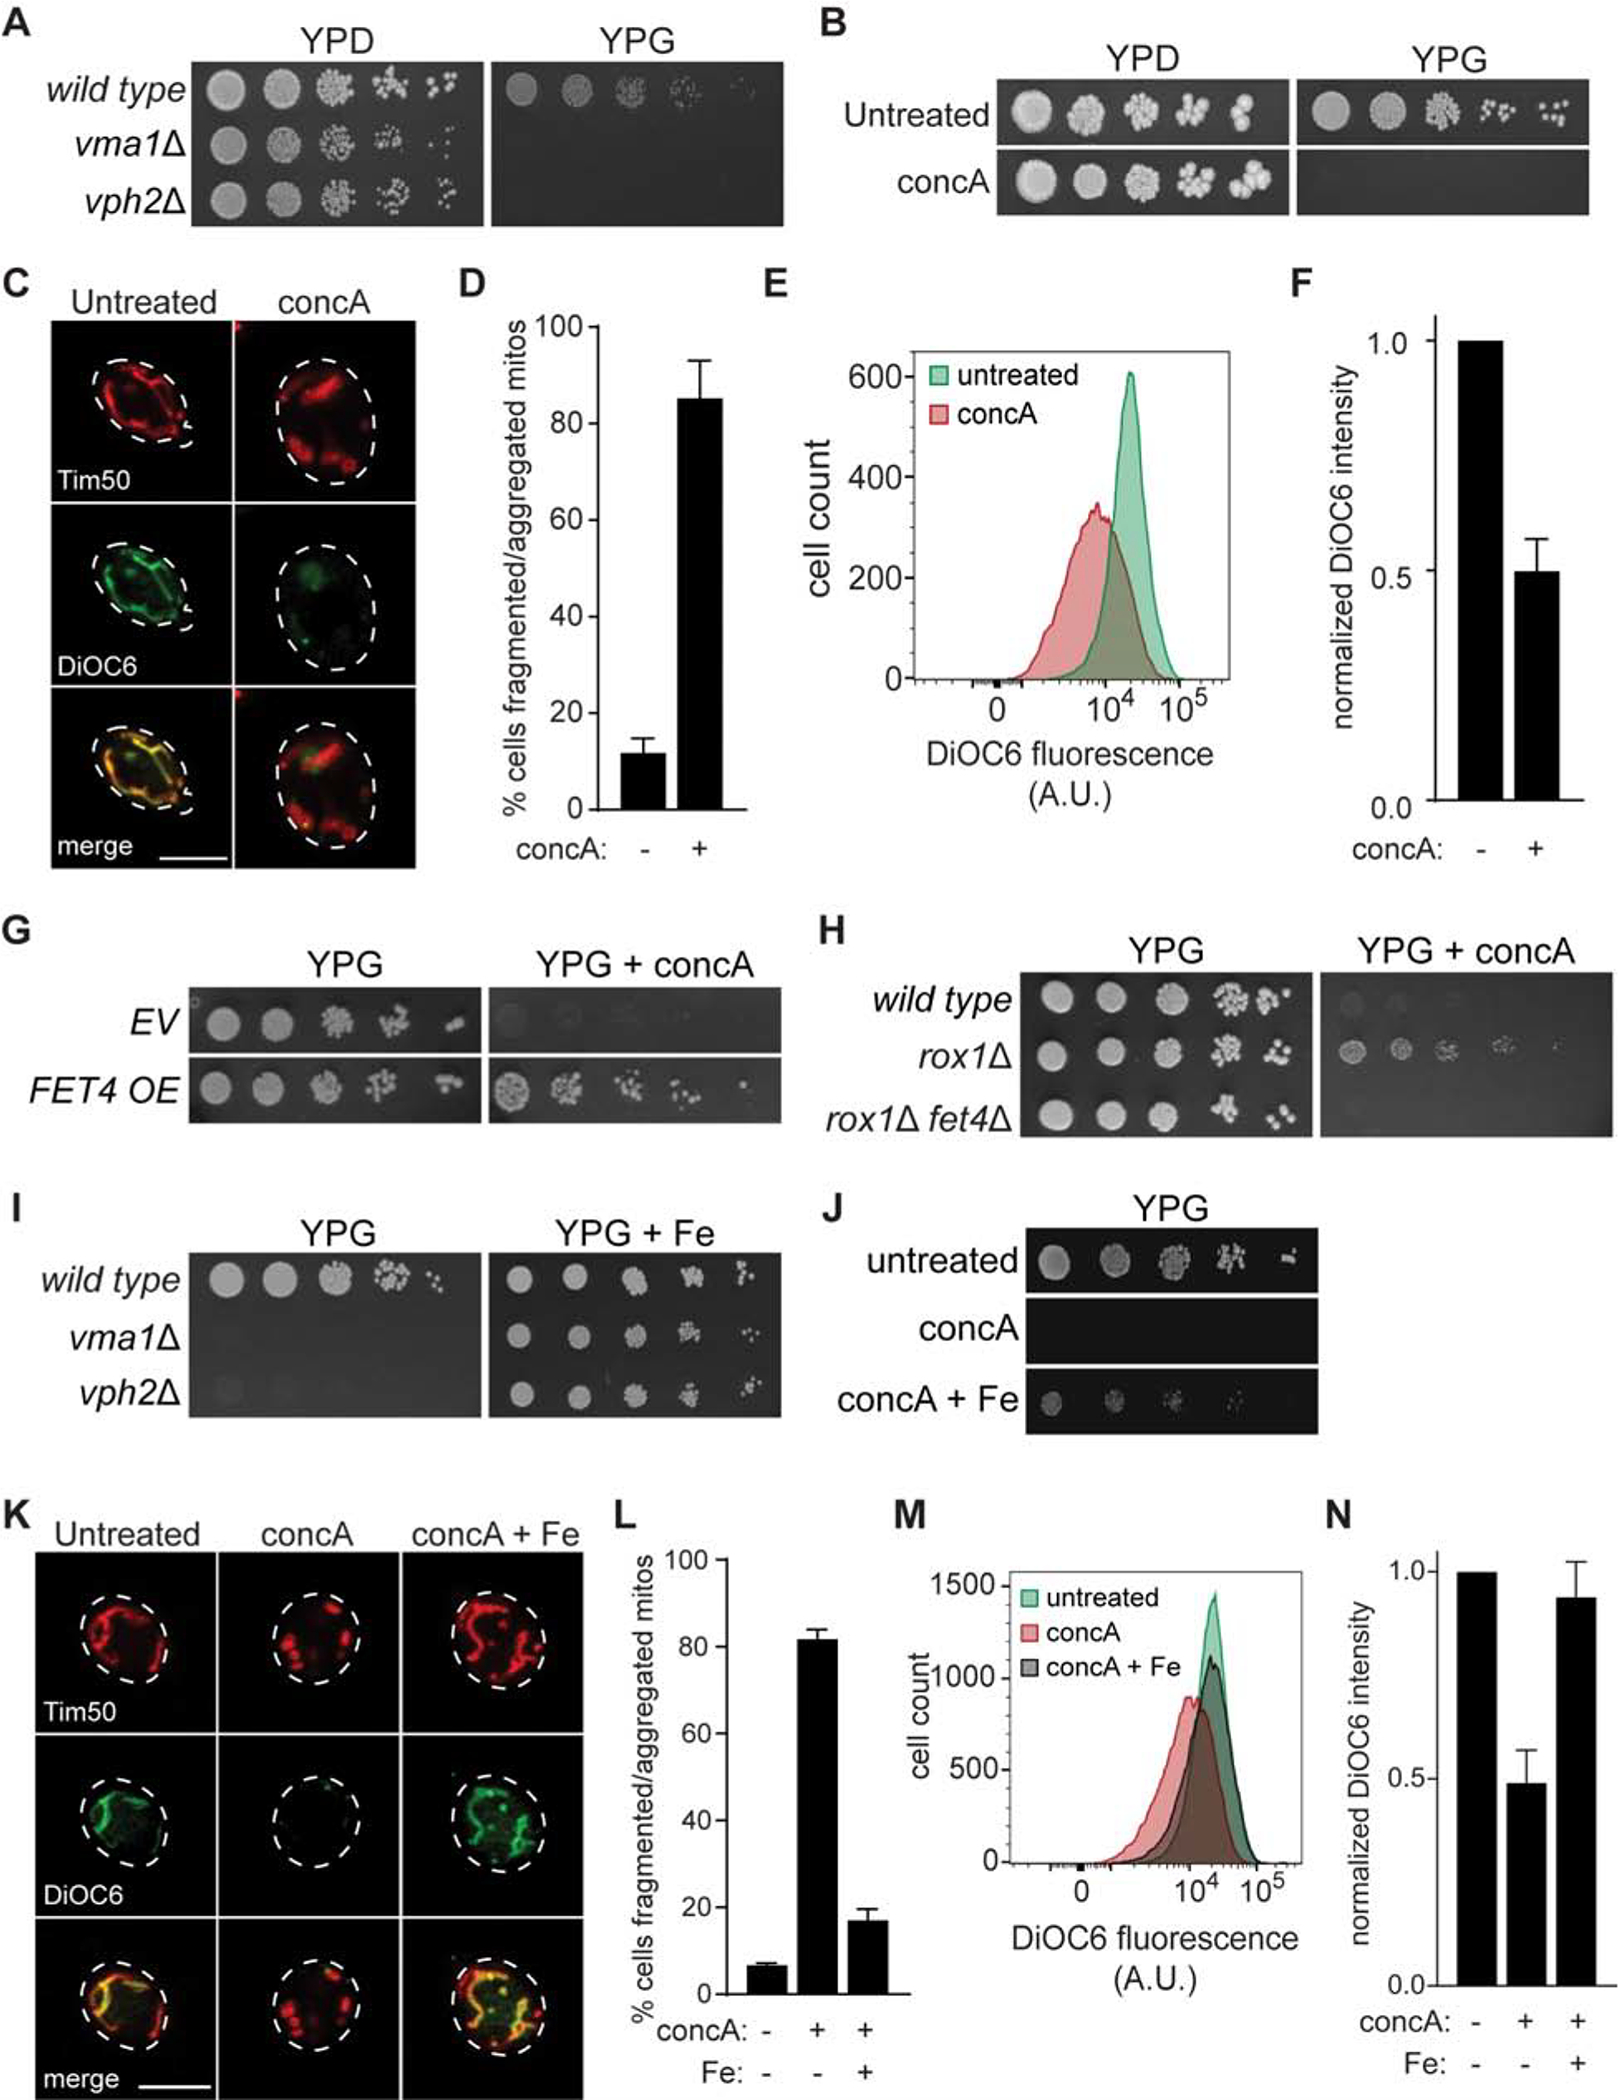
(A–B) Serial growth assays of the indicated yeast (A) on rich medium with glucose (YPD) or glycerol (YPG) as the carbon source +/− V-ATPase inhibitor concA (B). (C) Maximum-intensity projection images of yeast mitochondrial structure (Tim50-mCherry) and membrane potential (DiOC6 staining) in cells grown +/− concA for 4 hrs. Scale bar = 5 μm.
(D) Quantification of (C). Bars = mean ± SD, n=3. >100 cells per replicate.
(E) Flow cytometry analysis of DiOC6 stained yeast grown +/− concA for 4 hrs. A.U. = arbitrary units in all Figures.
(F) Quantification of (E). Median fluorescence values normalized to untreated. Bars = mean ± SD, n=3.
(G) Growth assays of yeast containing empty vector (EV) or a high-copy FET4 expression plasmid on YPG +/− concA.
(H) Growth assays of the indicated yeast on YPG +/− concA.
(I–J) Growth assays of the indicated yeast (I) on YPG +/− ferrous ammonium sulfate (Fe) +/− concA (J).
(K) Images obtained as in (C) from yeast grown +/− concA +/− Fe for 4 hrs. Scale bar = 5 μm.
(L) Quantification of (K). Bars = mean ± SD (n=3). >100 cells per replicate.
(M) Flow cytometry analysis of DiOC6 stained yeast grown +/− concA +/− Fe for 4 hrs.
(N) Quantification of (M). Median fluorescence values normalized to untreated. Bars = mean ± SD, n=3.
See also Figure S1