
Figure 2. V-ATPase Inhibition Causes Iron limitation and Impairs Mitochondrial Respiration.
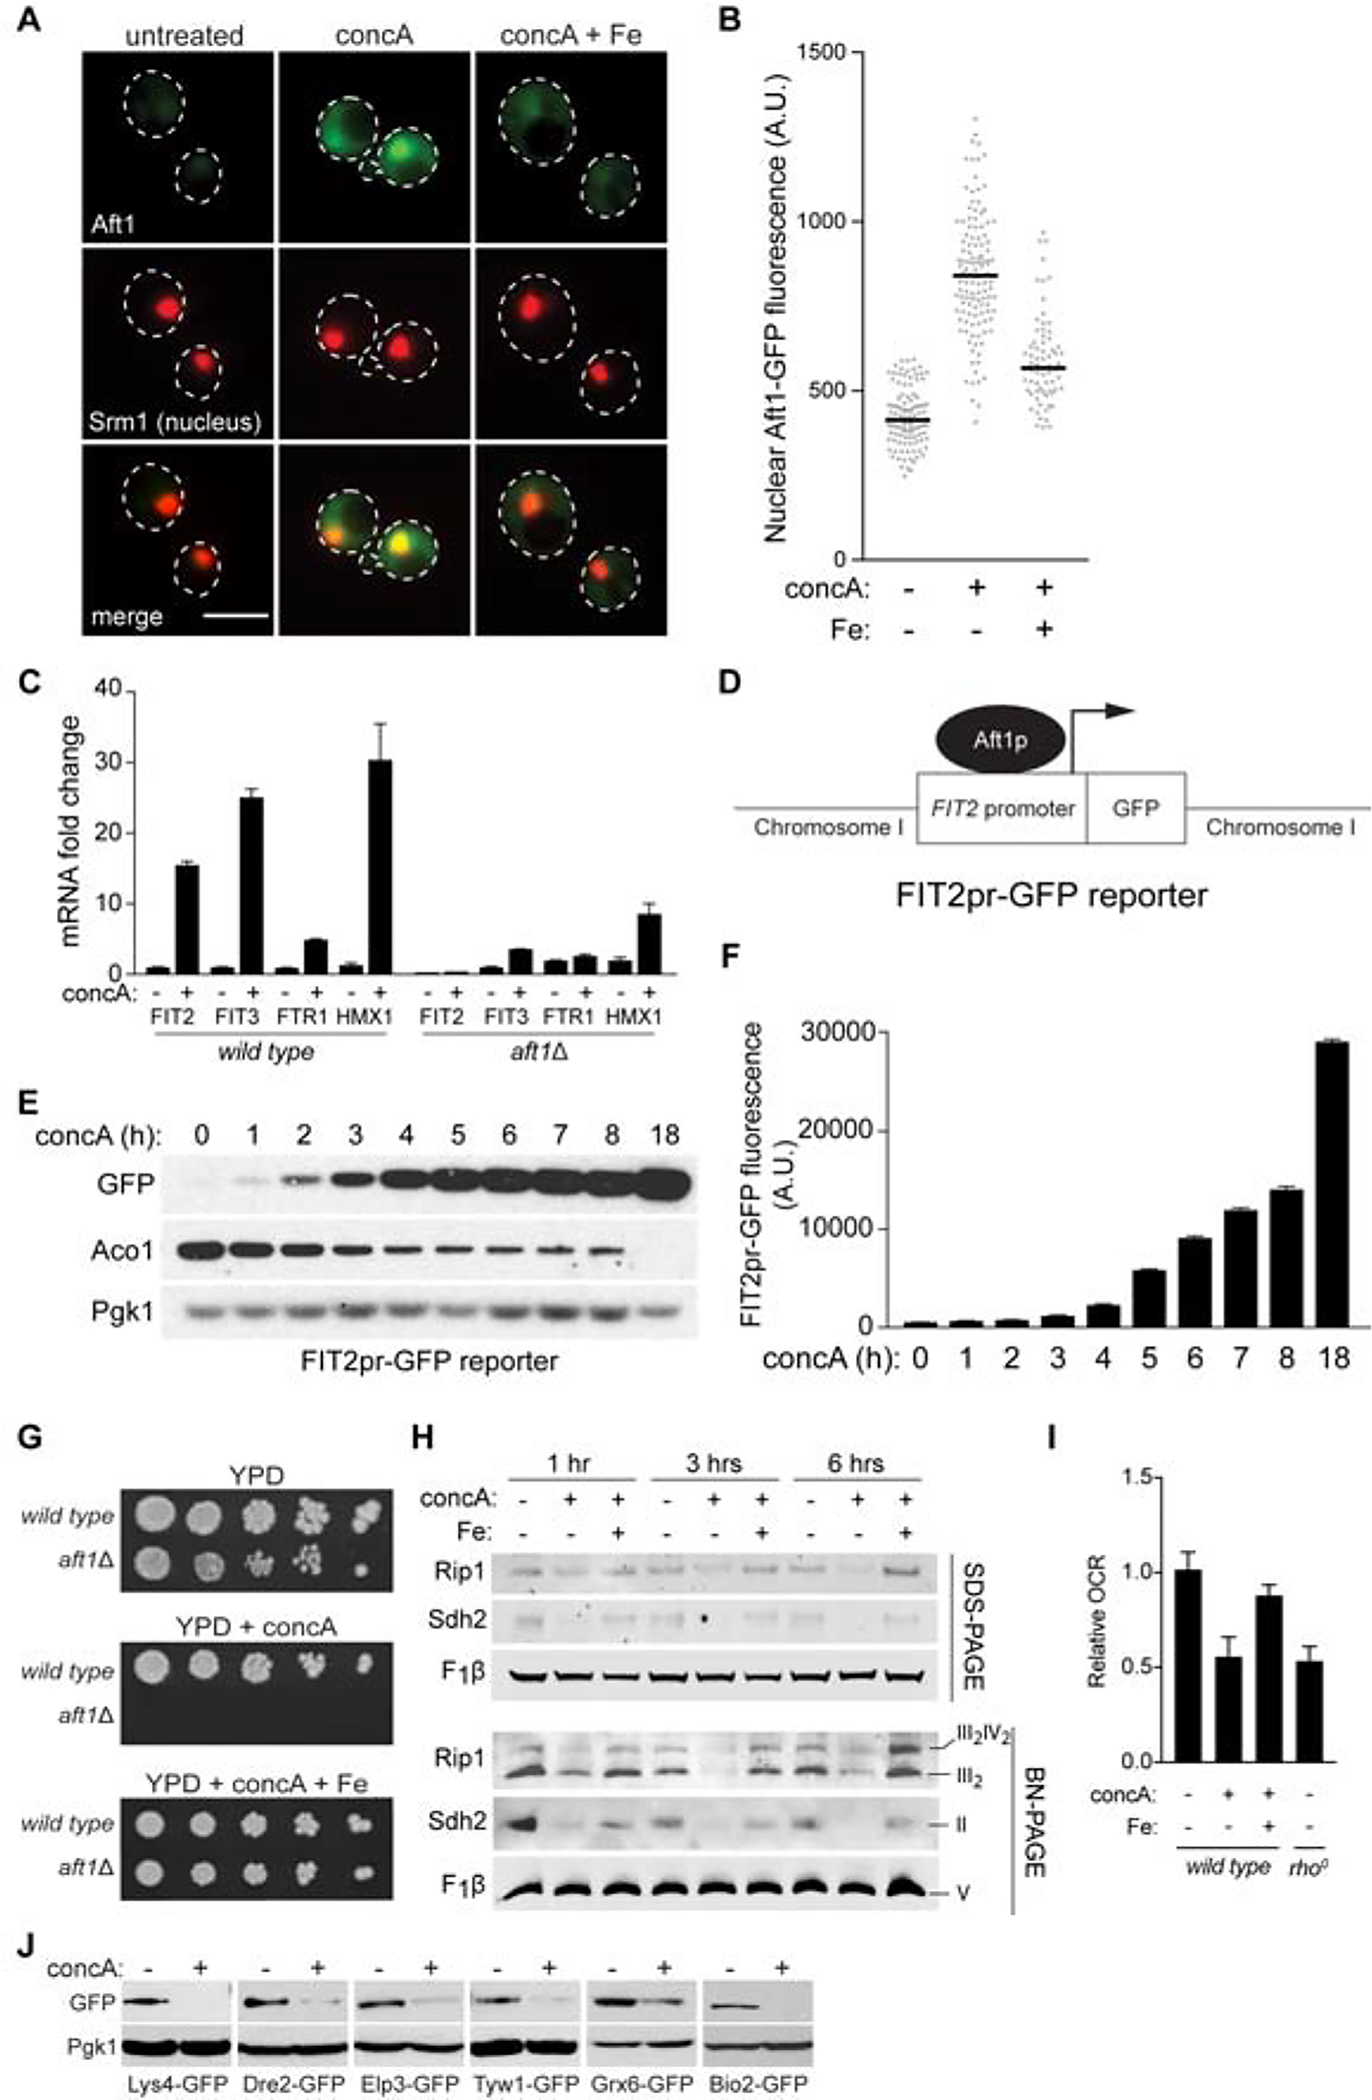
(A) Single Z-plane images showing Aft1-GFP nuclear translocation after 4 hrs concA treatment +/− Fe. Srm1-mCherry marks the nucleus. Scale bar = 5 μm.
(B) Quantification of nuclear fluorescence intensity from individual cells in (A). Bars = median. n >70 cells.
(C) qPCR showing fold change of the indicated Aft1 target genes after 6 hrs of concA treatment in wild type and aft1Δ strains. Values expressed relative to wild type DMSO treated. Bars = mean ± SD, n=3.
(D) Schematic of the Aft1 transcriptional reporter.
(E) Western blot of GFP driven from the FIT2 promoter and Aco1 during an 18-hour concA time course. Loading control, Pgk1.
(F) Flow cytometry analysis showing GFP expression from the FIT2 promoter increases in cells during 18 hours of concA treatment. Bars = mean ± SD, n=3.
(G) Growth assays of wild-type and aft1Δ yeast on YPD +/− concA +/− Fe.
(H) Steady-state levels of the indicated individual proteins (SDS-PAGE) and representative assembled respiratory complexes [Blue-Native (BN) PAGE] analyzed via Western blotting of crude mitochondrial fractions isolated from yeast treated with concA and Fe for 0–6 hrs. Rip1, Complex III; Sdh2, Complex II; F1β, Complex V.
(I) Relative oxygen consumption rate (OCR) of wild-type yeast grown −/+ concA −/+ Fe for 6 hrs and rho0 cells lacking mitochondrial DNA. Bars = mean ± SD, n=3.
(J) Western blot showing protein levels of GFP-epitope tagged ISC-containing proteins from various cellular compartments are reduced after 4 hrs concA treatment. Mitochondria, Lys4 and Bio2; cytoplasm, Dre2; nucleus, Elp3; ER, Tyw1 and Grx6; loading control, Pgk1.
See also Figure S2