
Figure 5. Cysteine Limits Iron Bioavailability and Mitochondrial Function Upon V-ATPase Deficiency.
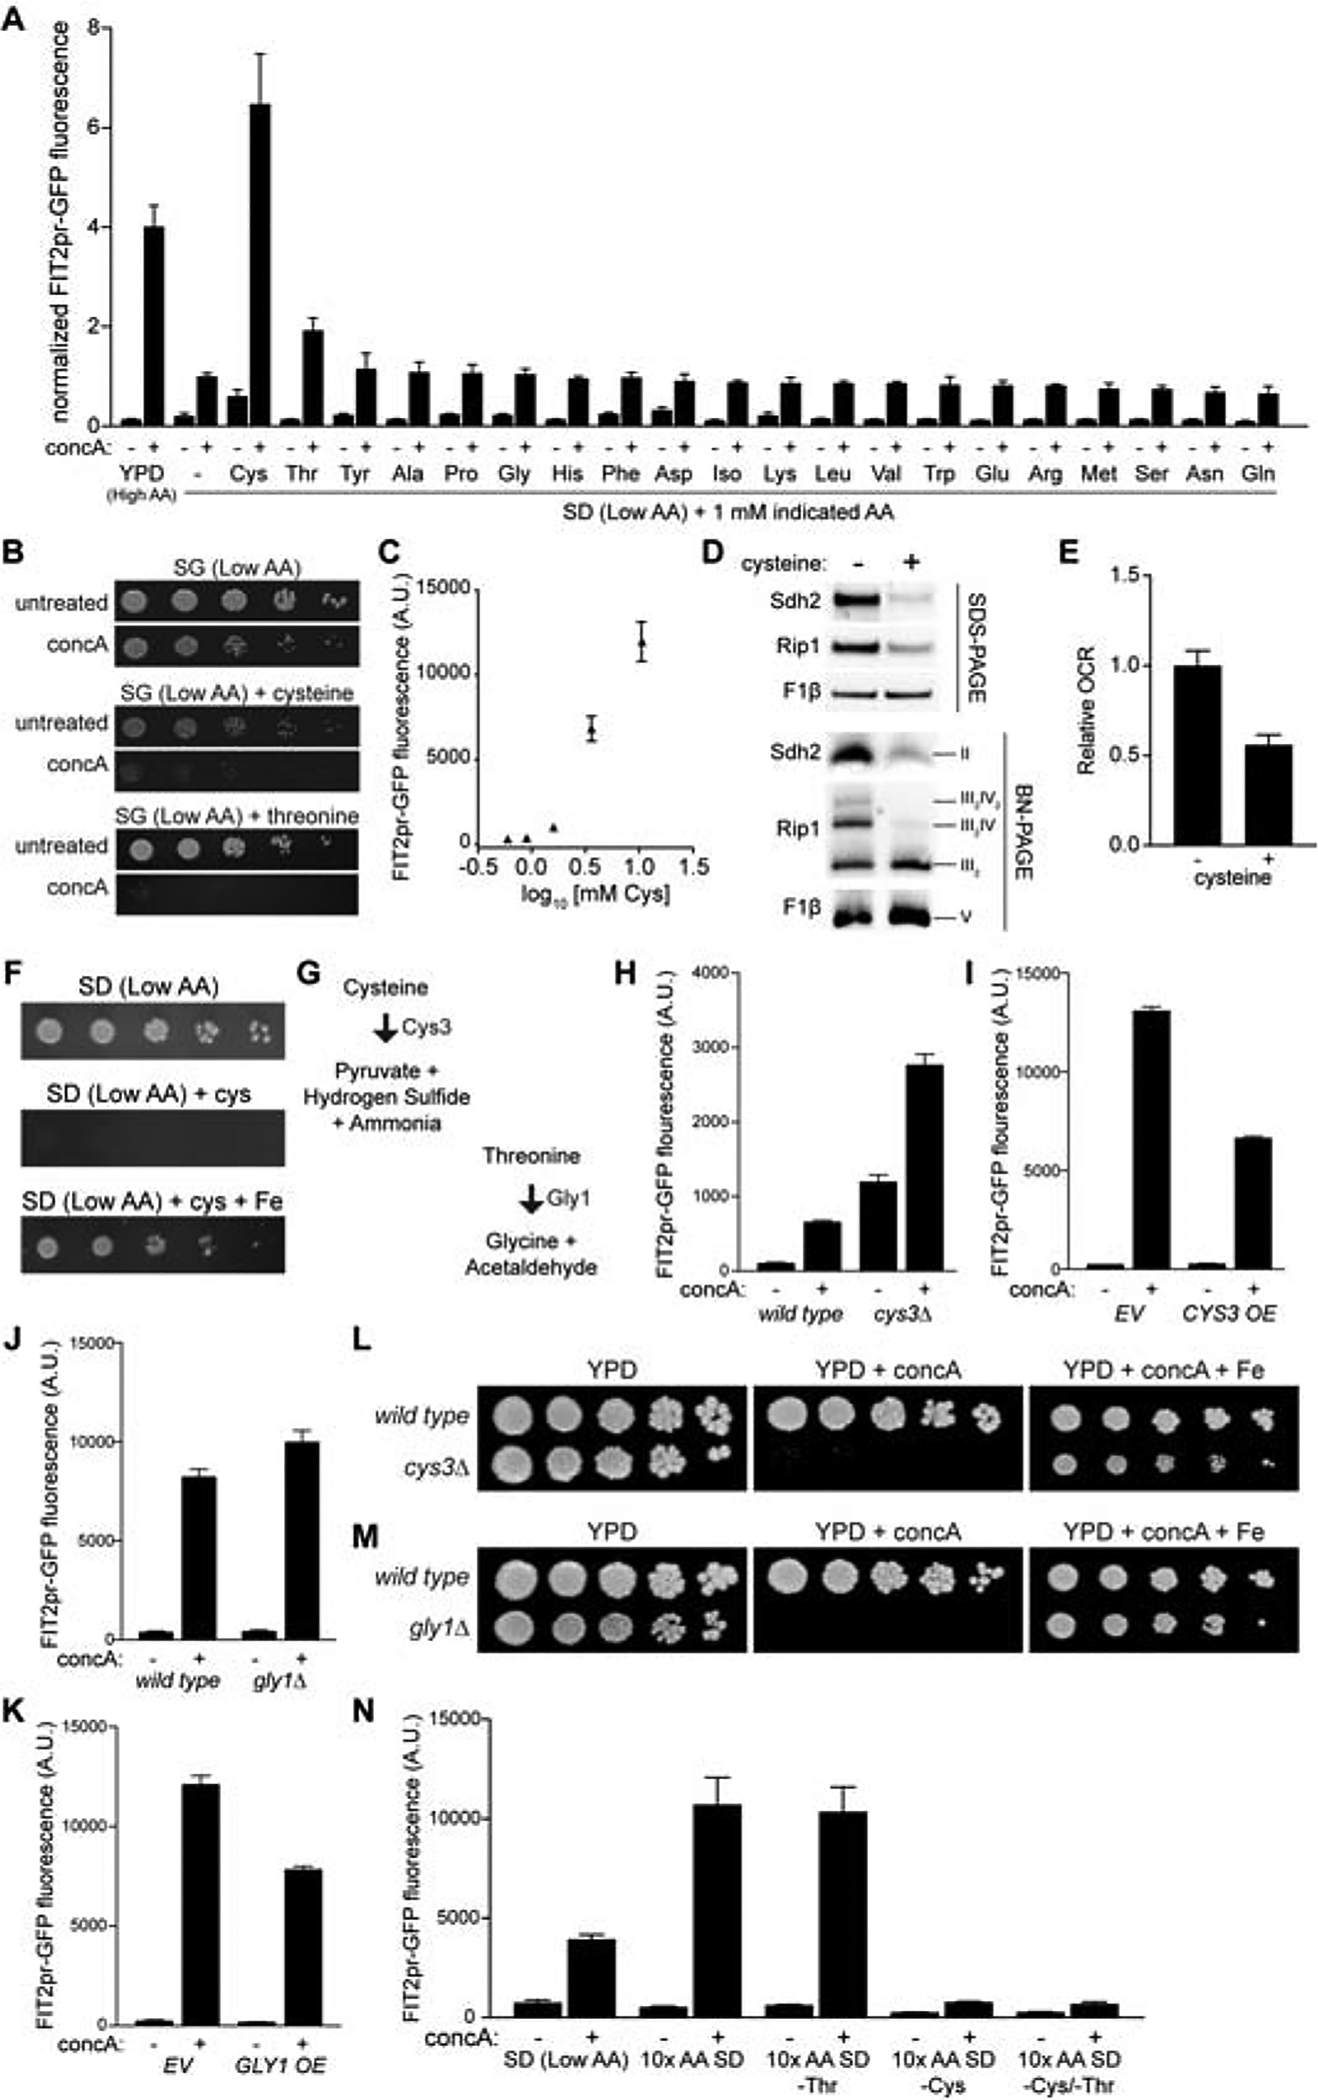
(A) Flow cytometry analysis of FIT2pr-GFP fluorescence in yeast cultured +/− concA for 6 hrs in the indicated medium. Values normalized to SD + concA. Bars = mean ± SD, n=3.
(B) Growth assays of wild-type yeast +/− concA on low amino acid glycerol medium plus indicated AA. [Cysteine] = 1 mM, [Threonine] = 15 mM.
(C) Flow cytometry analysis of FIT2pr-GFP fluorescence in yeast cultured in low amino acid medium with increasing concentrations of cysteine for 6 hrs. Plotted values = mean ± SD, n=3.
(D) Steady-state levels of the indicated individual proteins (SDS-PAGE) and representative assembled respiratory complexes [Blue-Native (BN) PAGE] analyzed via Western blotting of crude mitochondrial fractions isolated from yeast treated −/+ excess cysteine for 6 hrs. Rip1, Complex III; Sdh2, Complex II; F1β, Complex V.
(E) Relative oxygen consumption rate (OCR) of wild-type yeast grown −/+ excess cysteine for 6 hrs. Bars = mean ± SD, n=3.
(F) Growth assays of wild-type yeast on low amino acid medium +/− 15 mM cysteine +/− Fe.
(G) Two major routes of cysteine and threonine degradation.
(H–K) Flow cytometry analysis of FIT2pr-GFP fluorescence in the indicated wild type and mutant yeast strains (H and J) or in wild-type strains overexpressing the indicated gene (I and K) treated +/− concA for 6 hrs. Bars = mean ± SD, n=3.
(L–M) Growth assays of wild type and the indicated mutant yeast on YPD +/− concA +/− Fe.
(N) Flow cytometry analysis of FIT2pr-GFP fluorescence in yeast cultured +/− concA for 6 hrs in the low AA medium +/− 10X AA with or without cysteine and threonine. Bars = mean ± SD, n=3.
See also Figure S5