
Figure 6. V-ATPase deficiency and Elevated Cysteine Impact Iron Homeostasis via an ROS-based mechanism.
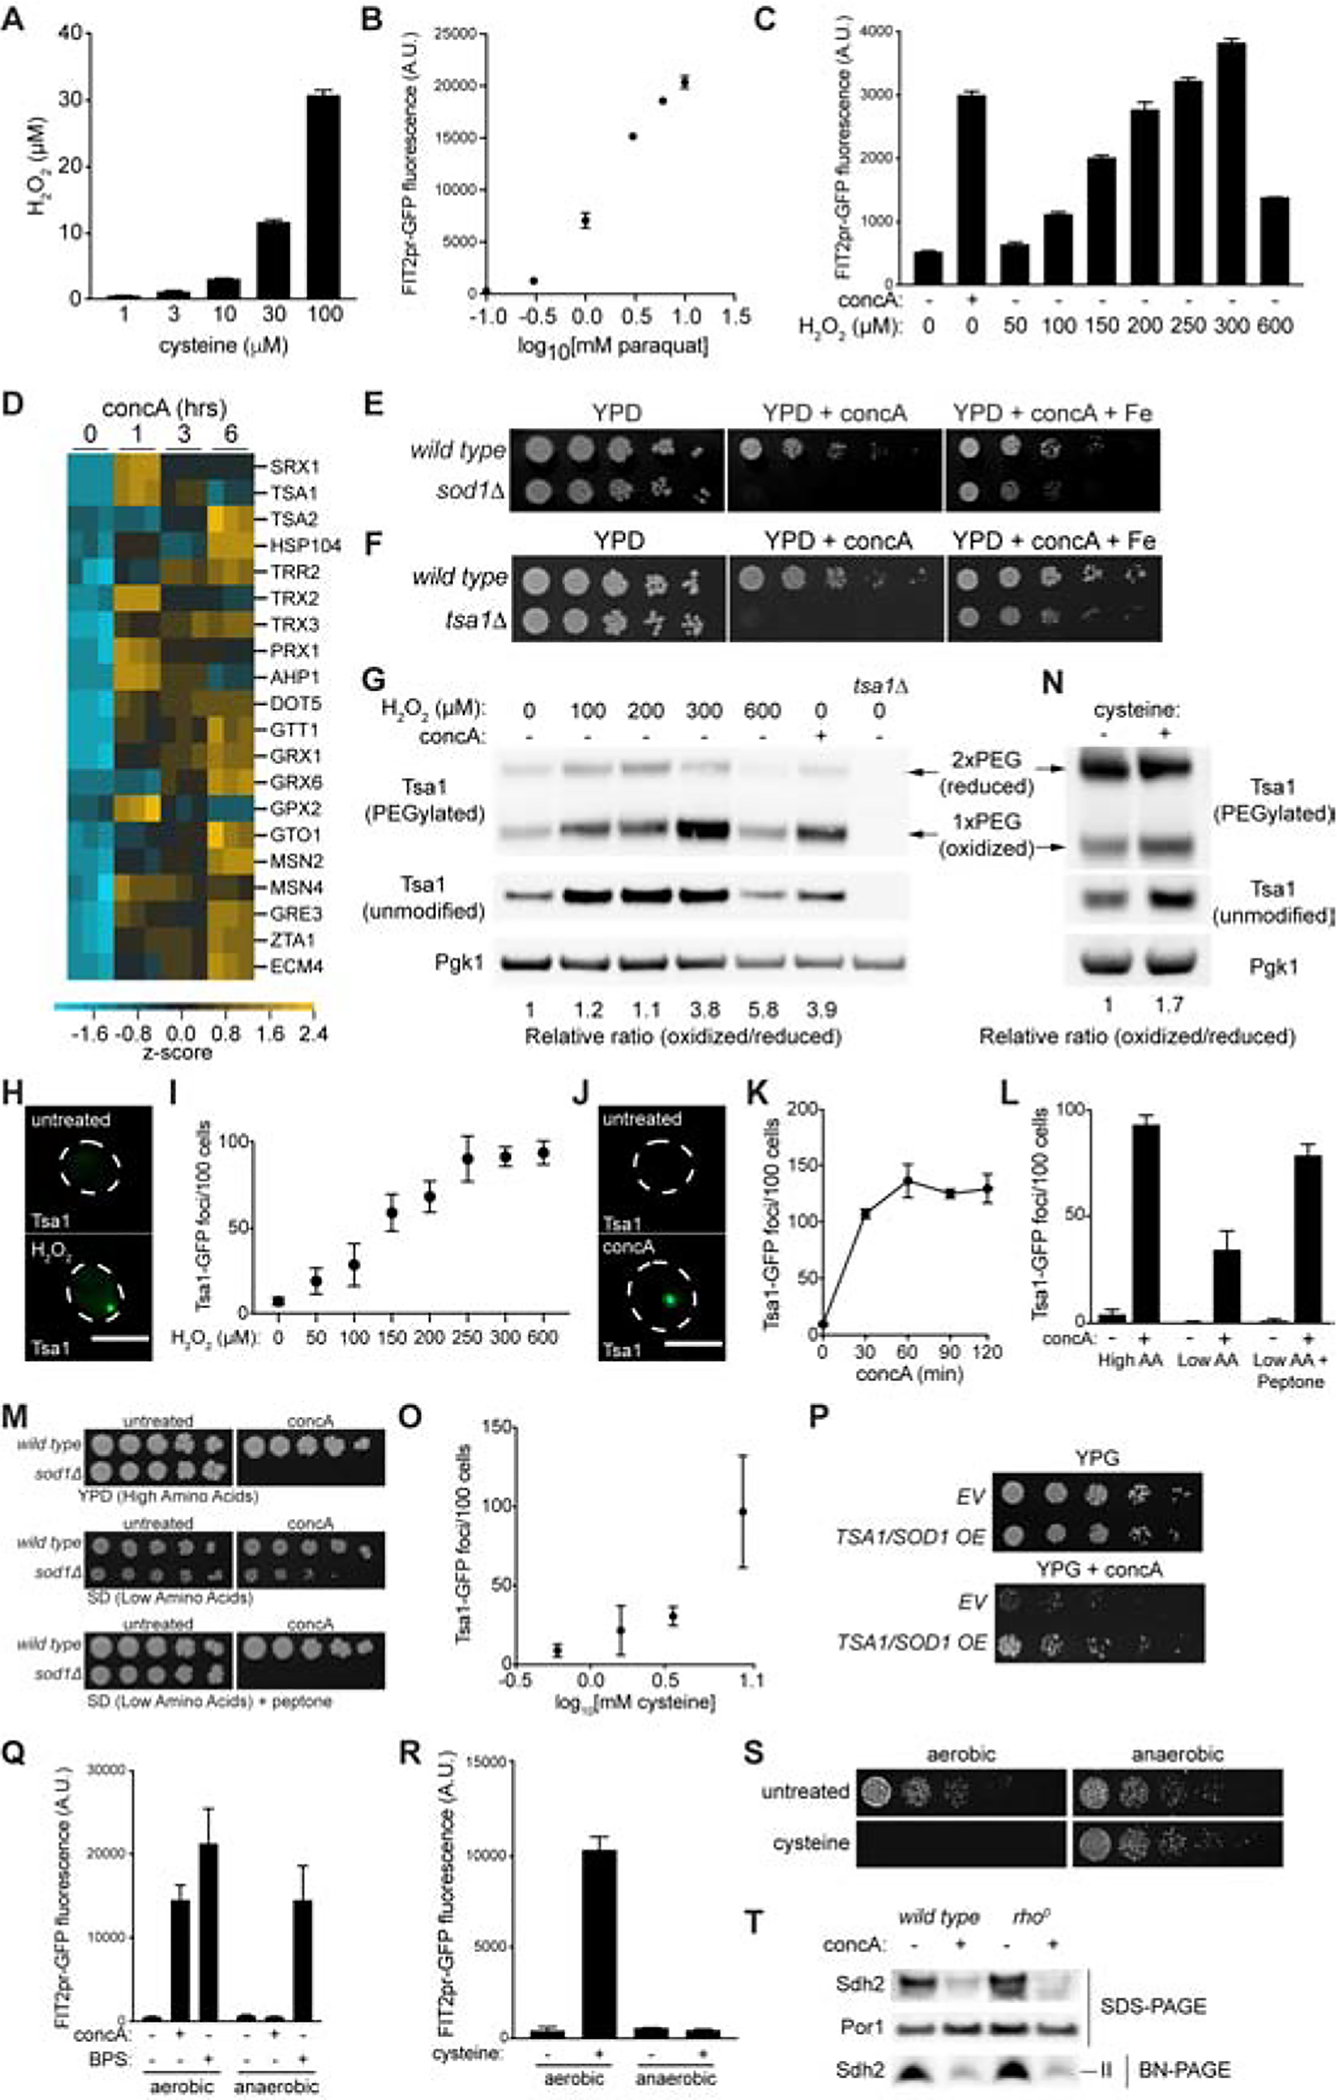
(A) Amplex red measurements of hydrogen peroxide produced by indicated concentration of cysteine incubated in the presence of copper for 1 hr. Bars = mean ± SD, n=3.
(B–C) Flow cytometry analysis of FIT2pr-GFP fluorescence in yeast cultured with increasing concentration of paraquat (B) or hydrogen peroxide (C) for 6 or 2 hrs, respectively. Bars = mean ± SD, n=3.
(D) Heat map showing Z-scores of transcripts from RNA sequencing analysis conducted on yeast treated with concA for the indicated time. Blue = downregulated, yellow = upregulated.
(E–F) Growth assays of wild-type and the indicated mutant yeast on YPD +/− concA +/− Fe.
(G and N) Western blot of whole cell lysates from cells treated with hydrogen peroxide, concA, or elevated cysteine as indicated. Lysates were incubated with (PEGylated) or without (unmodified) PEG-maleimide prior to immunoblotting. Pgk1 = loading control. Oxidized and reduced forms of Tsa1 are indicated.
(H and J) Maximum-intensity projection images showing Tsa1-GFP foci in yeast grown either +/− hydrogen peroxide (H) or +/− concA (J) for 1.5 hrs. Scale bar = 5 μm.
(I and K) Quantification of number of Tsa1-GFP foci from maximum intensity projection images of cells treated with the indicated concentration of hydrogen peroxide (I) or concA for the indicated time (K). Values = mean ± SD, n=3.
(L) Quantification of Tsa1-GFP foci from maximum intensity projection images of cells treated with concA for 1.5 hrs in the indicated medium. Bars = mean ± SD, n=3.
(M) Growth assays of wild-type and sod1Δ yeast on the indicated medium.
(O) Quantification of number of Tsa1-GFP foci from maximum intensity projection images of cells cultured in low amino acid medium with increasing concentrations of cysteine for 1.5 hrs. Values = mean ± SD, n=3.
(P) Growth assays of yeast containing empty vector (EV) or high-copy TSA1 and SOD1 expression plasmids on YPG +/− concA + low dose iron (10 μM).
(Q and R) Flow cytometry analysis of FIT2pr-GFP fluorescence in wild type yeast treated +/− concA, +/− BPS, or +/− cysteine in the presence (aerobic) or absence (anaerobic) of oxygen for 18 hrs. Bars = mean ± SD, n=3.
(S) Growth assays of wild type yeast +/− excess cysteine +/− oxygen.
(T) Steady-state levels of the indicated individual proteins (SDS-PAGE) and assembled respiratory complex II (Sdh2) [Blue-Native (BN) PAGE] analyzed via Western blotting of crude mitochondrial fractions isolated from wild type or rho0 yeast treated +/− concA for 6 hrs.