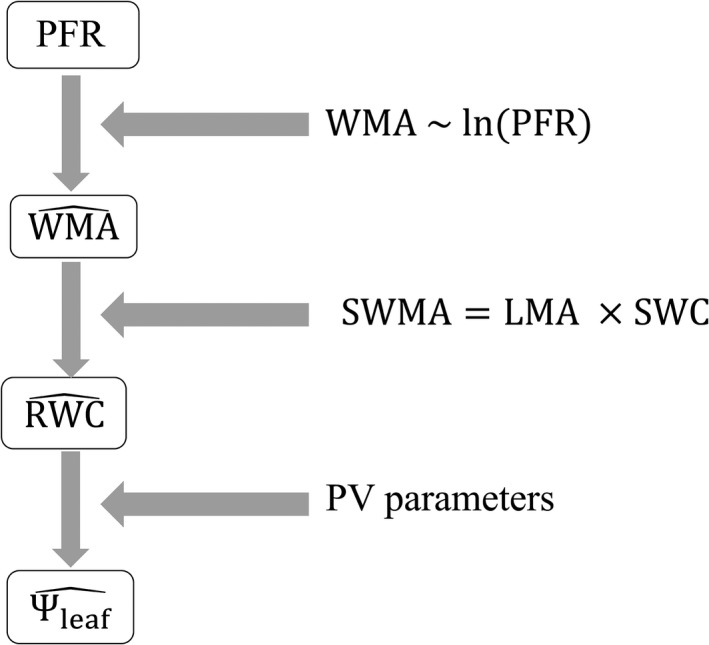
Figure 5.

Flowchart illustrating the inputs to for the hierarchical prediction of water status variables from terahertz spectroscopy peak field ratio (PFR) and leaf traits (see Equations and Table 1 for further information about variables and symbols). Based on the relationship of water mass per area (WMA) to ln (PFR) for each dehydrating leaf, predictions are made of water mass per area (). Then, relative water content () is estimated, accounting for saturated water mass per leaf area (SWMA), which is the product of leaf dry mass per area (LMA) and saturated water content (SWC). Finally, leaf water potential () is estimated using pressure–volume curve (PV) parameters. These predictions were tested using the relationship of water mass per area (WMA) to ln (PFR) for individual leaves, or all leaves of given species, or across all leaves for the three species tested (Table 4)
