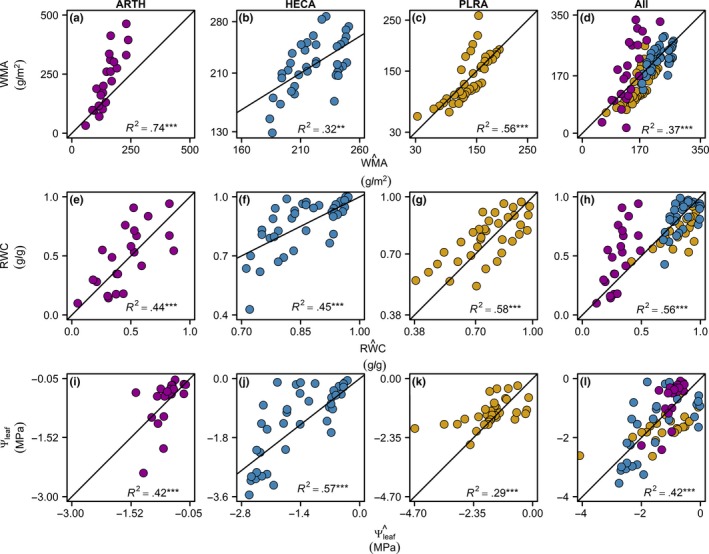
Figure 8.

Species‐specific predictions of leaf water status using terahertz spectroscopy. Plots of observed values against predicted values for leaf water mass per area (WMA), relative water content (RWC), and leaf water potential (Ψleaf). Species‐level and all‐species‐level WMA were predicted for each measurement of PFR using species‐specific and all species regression parameters, respectively (Table S2). Statistical significance: not significant, ns; **, p < .01; ***, p < .001
