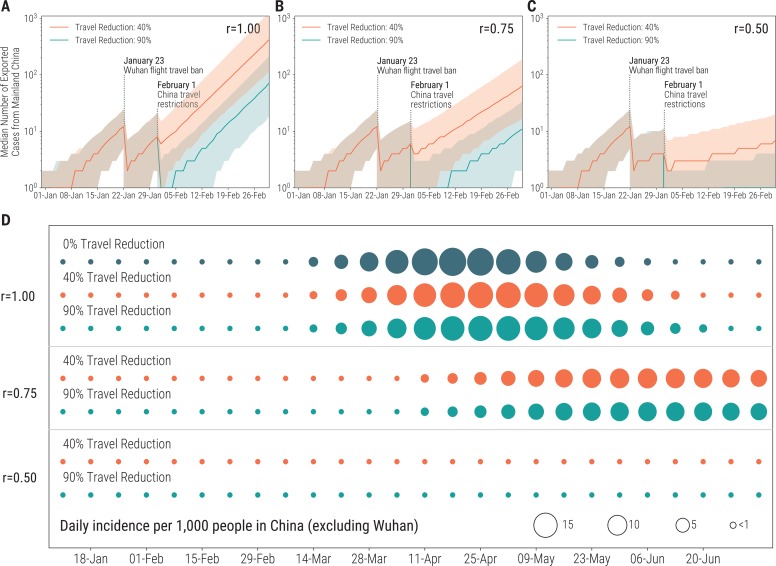
Fig. 4. Combined effects of travel and transmissibility reductions on the epidemic.
(A) Median total number of imported infections from mainland China with no transmissibility reduction and travel reductions of 40 and 90%. (B) Same as (A) for the moderate transmissibility reduction scenario (r = 0.75). (C) Same as (A) for the strong transmissibility reduction scenario (r = 0.5). Shaded areas represent 90% CIs. (D) Disease incidence in mainland China, excluding Wuhan, for the scenarios plotted in (A) to (C).

