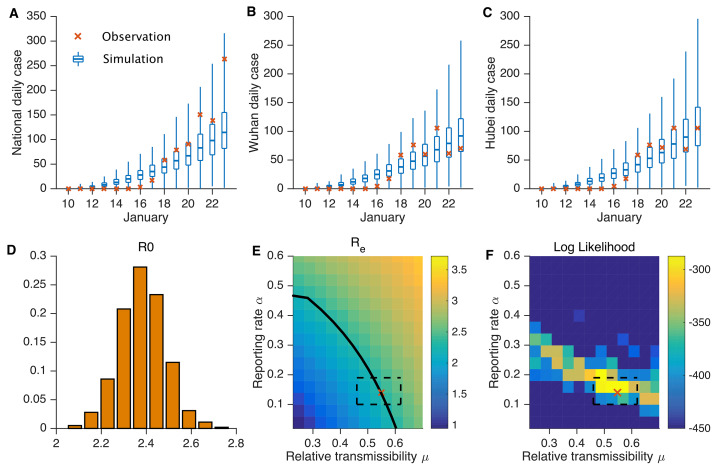
Fig. 1. Best-fit model and sensitivity analysis.
Simulation of daily reported cases in all cities (A), Wuhan city (B), and Hubei province (C). The blue box and whiskers show the median, interquartile range, and 95% CIs derived from 300 simulations using the best-fit model (Table 1). The red x’s are daily reported cases. (D) The distribution of estimated Re. (E) The impact of varying α and μ on Re with all other parameters held constant at Table 1 mean values. The black solid line indicates parameter combinations of (α,μ) yielding Re = 2.38. The estimated parameter combination α = 0.14 and μ = 0.55 is indicated by the red x; the dashed box indicates the 95% credible interval of that estimate. (F) Log likelihood for simulations with combinations of (α,μ) and all other parameters held constant at Table 1 mean values. For each parameter combination, 300 simulations were performed. The best-fit estimated parameter combination α = 0.14 and μ = 0.55 is indicated by the red x (the x is plotted at the lower-left corner of its respective heat map pixel, i.e., the pixel with the highest log likelihood); the dashed box indicates the 95% CI of that estimate.

