
Figure 2:
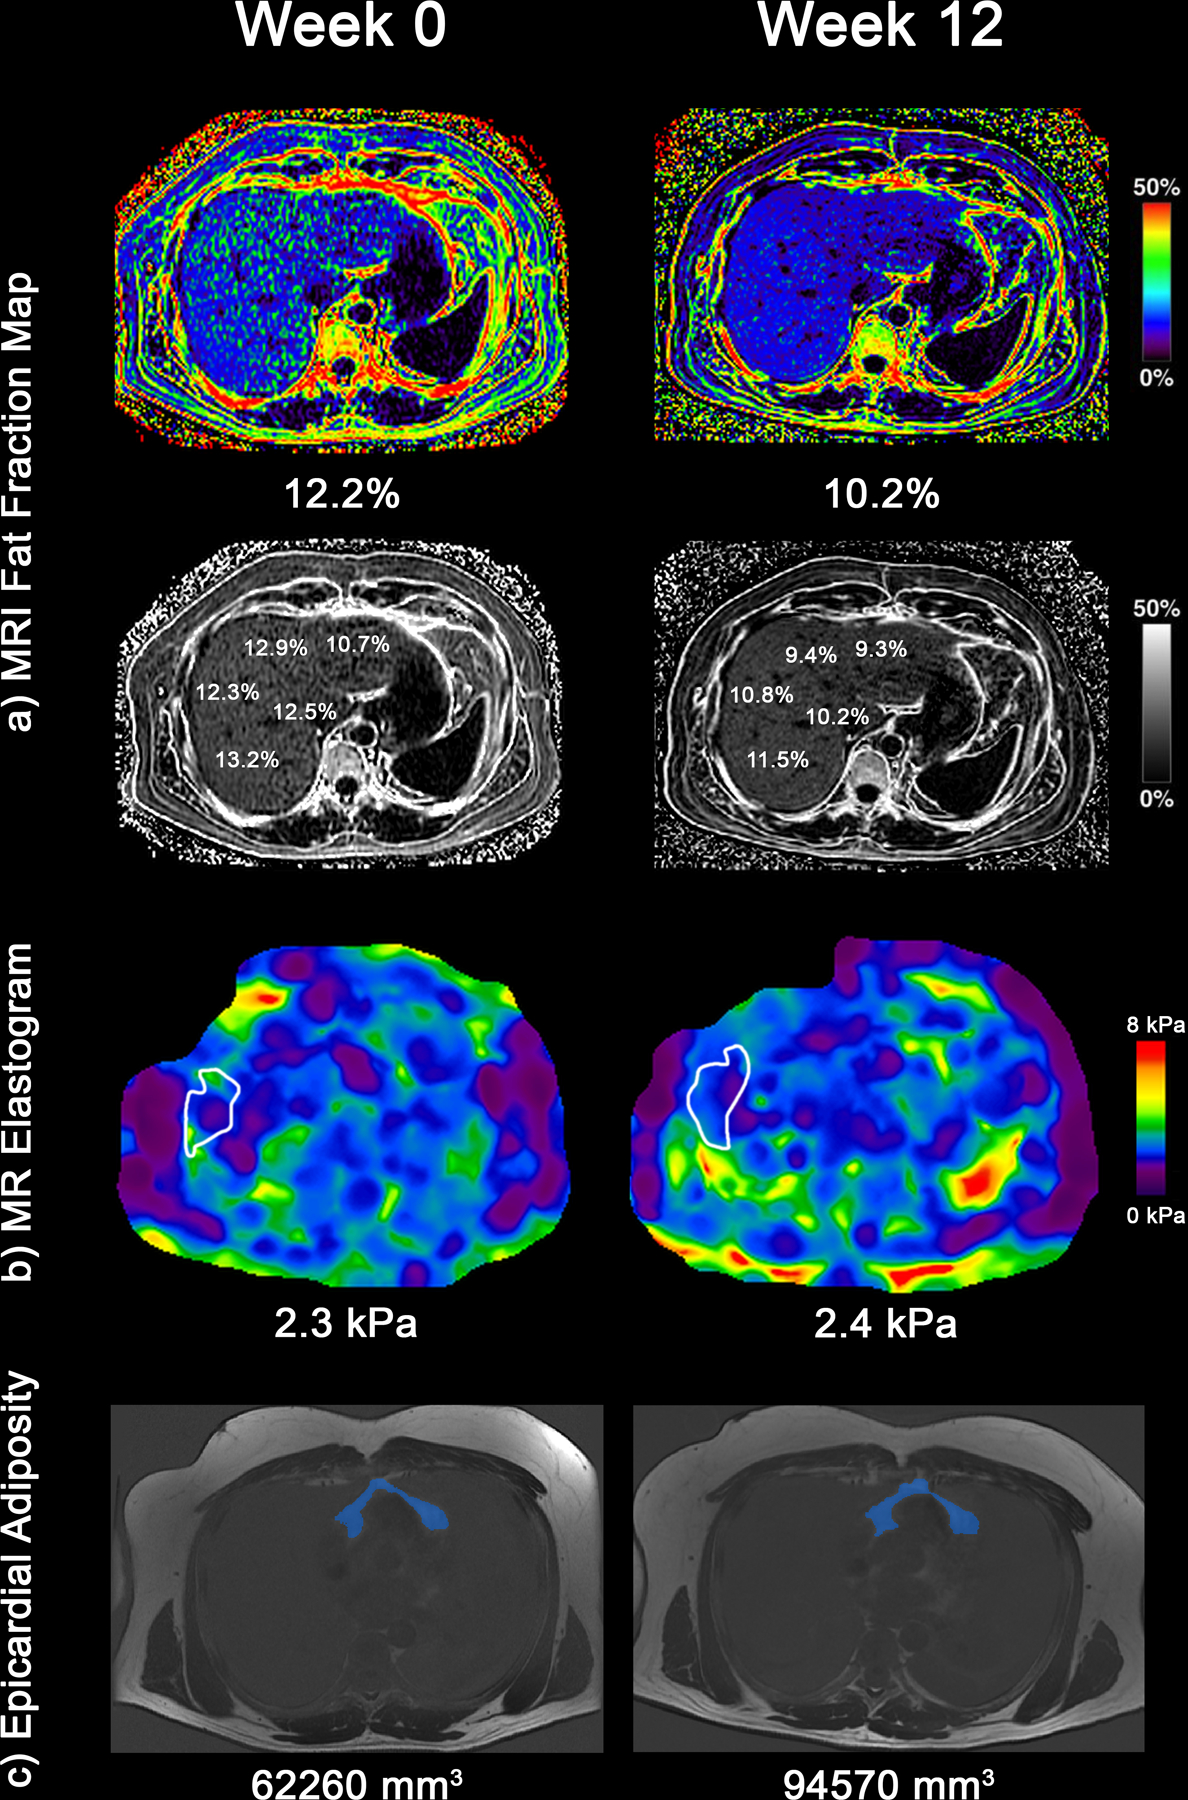
In a representative patient (a) MRI-PDFF fat mapping of the liver. The patient’s average liver fat fraction decreased from 12.2% (Week 0) to 10.2% (Week 12) (b) MRE elastograms depicting liver stiffness throughout the entire liver with average liver stiffness increasing from 2.3 kPa to 2.4 kPa (c) Epicardial fat volume on MRI increased from 62,260 mm3 at week 0 to 94,570 mm3 at week 12.