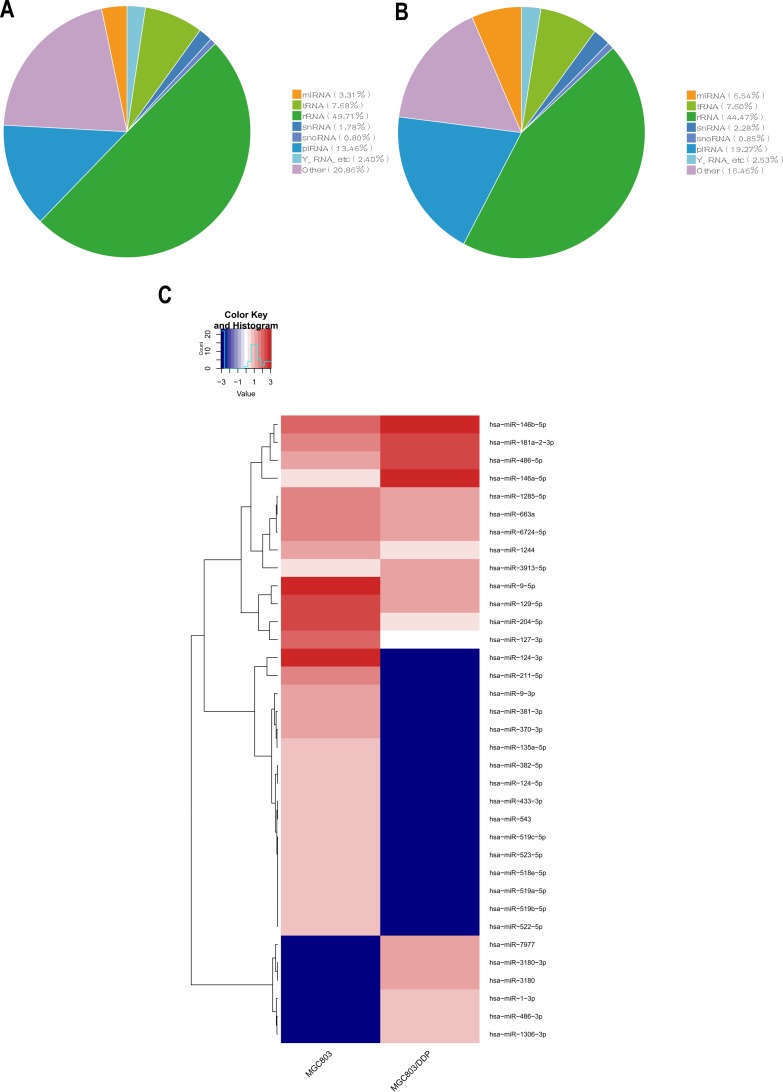
Figure 1. Analysis for sRNA-seq data of MGC803/DDP and MGC803 groups.
(A, B) Pie charts showing the percentage of different kinds of sRNA to the mapped reads for MGC803 group (A) and MGC803/DDP group (B). (C) A heat map of the 35 diferentially expressed miRNAs in MGC803/DDP and MGC803 groups was showed.

