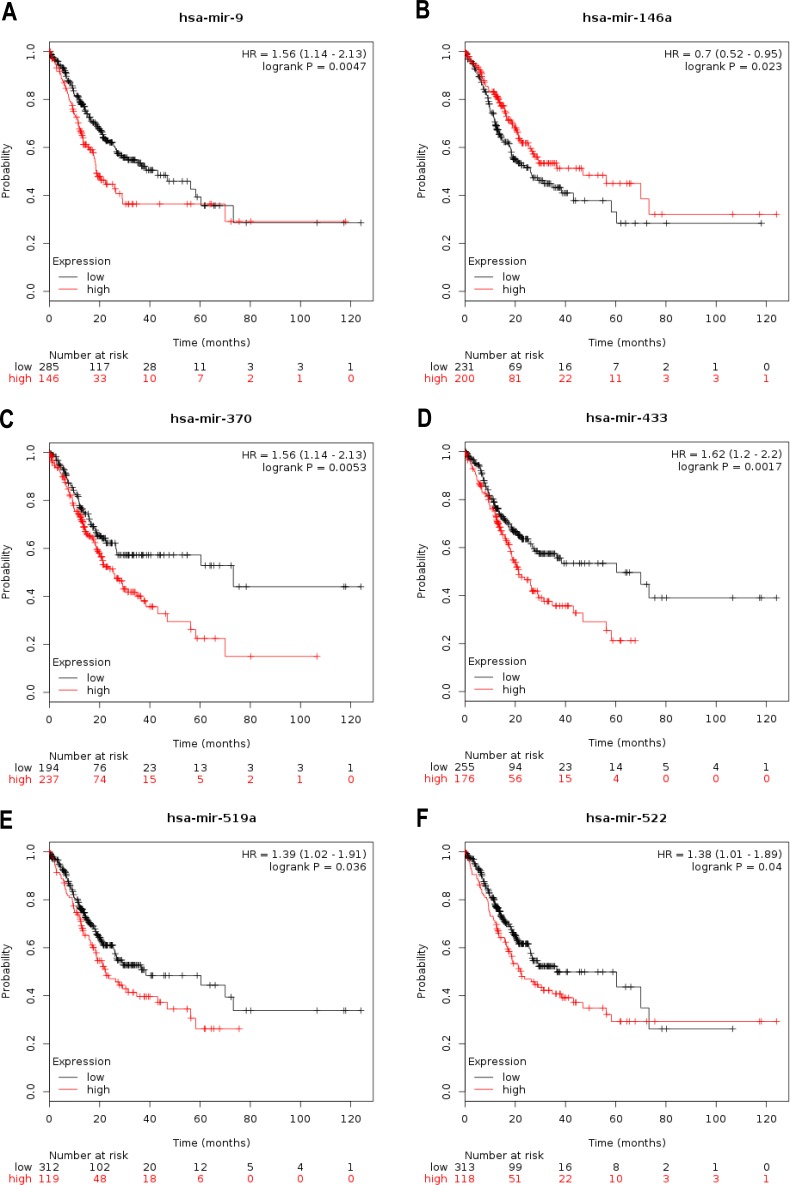
Figure 2. The role of 7 selected miRNAs was ascertained using Kaplan–Meier survival data according to Kaplan–Meier Plotter.
(A–F) Kaplan-Meier survival curves suggested that patients with high miR-9 (A), miR-370 (C), miR-433 (D), miR-519a (E) and miR-522 (F) levels had lower OS times for 10-year OS than those with low levels, and patients with high miR-146a (B) levels had higher OS times for 10-year OS than those with those low levels.

