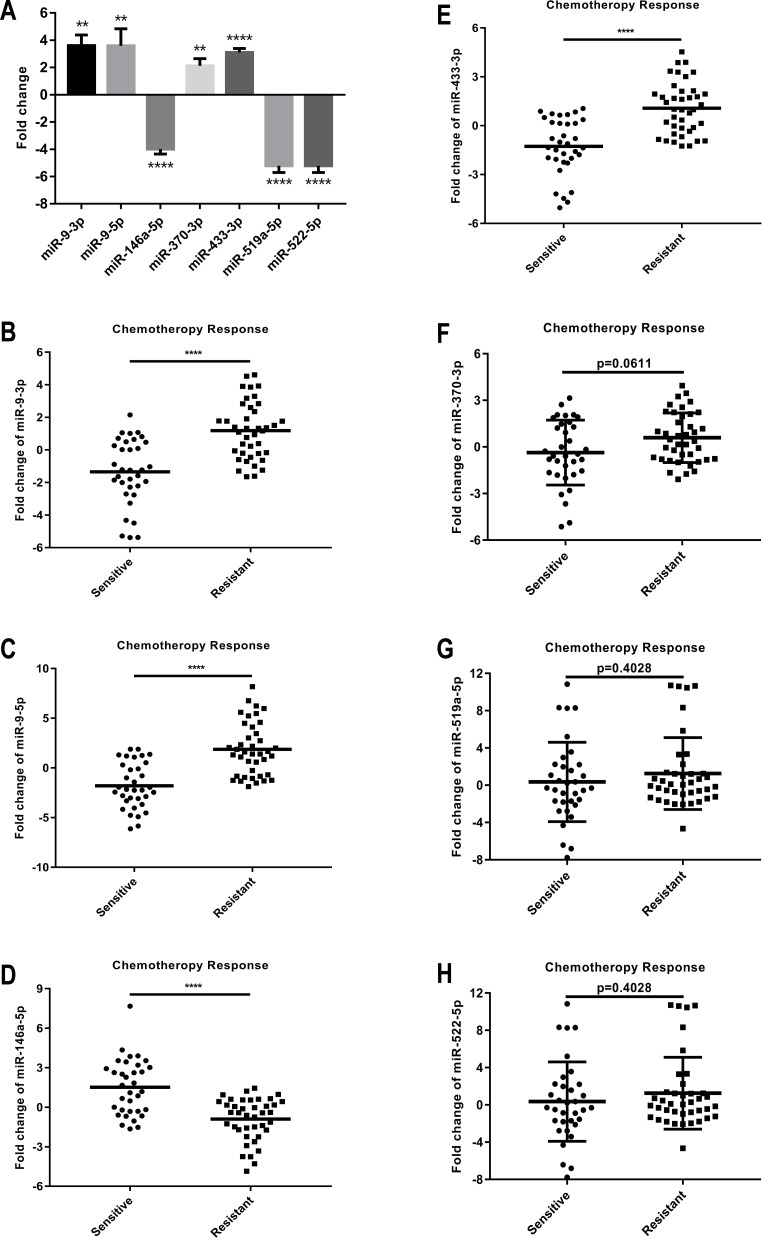
Figure 4. Expression levels and functions of seven selected miRNAs in human GC cells and clinical specimens.
(A) The relative level (fold change) of these seven selected miRNAs between DDP-resistant MGC803/DDP cells and parental MGC803 cells was analyzed via RT-qPCR. (B–E) The relative levels of miR-9-3p (B), miR-9-5p (C), miR-146a-5p (D), and miR-433-3p (E) between 34 chemotherapy response sensitive gastric cancer serums and 40 chemotherapy response resistant gastric cancer serums were significantly different, which were measured using RT-qPCR. (F–H) The relative levels of miR-370-3p (F), miR-519a-5p (G), and miR-522-5p (H) between 34 chemotherapy response sensitive gastric cancer serums and 40 chemotherapy response resistant gastric cancer serums didn’t show significantly different, which were measured using RT-qPCR. Each assay was conducted in triplicate. ****P < 0.0001, ***P < 0.001, **P < 0.01, *P < 0.05 and mean ± SD were utilized to show the data.

