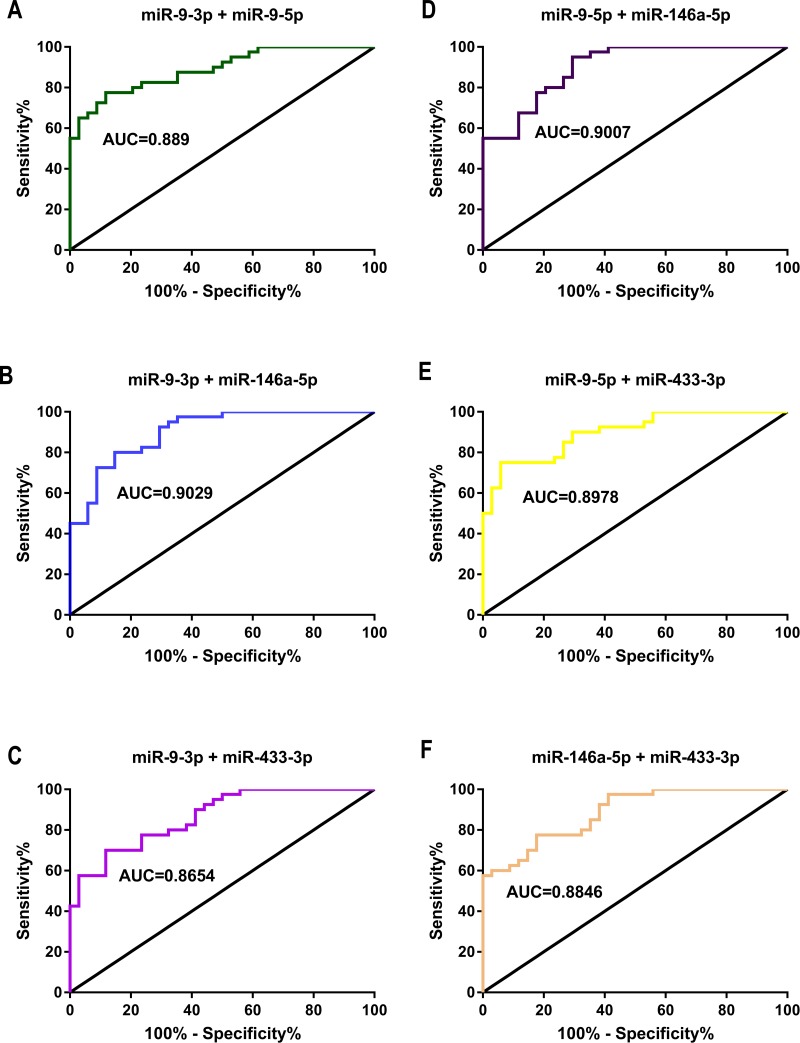
Figure 6. ROC curve and AUC value in comparison of the prognostic accuracy for DDP response with two combined miRNAs expression.
(A–F) ROC curves and AUC values of miR-9-3p combined with miR-9-5p (A), miR-9-3p combined with miR-146a-5p (B), miR-9-3p combined with miR-433-3p (C), miR-9-5p combined with miR-146a-5p (D), miR-9-5p combined with miR-433-3p (E) and miR-146a-5p combined with miR-433-3p (F) distinguished the GC chemotherapy response-resistant group from the GC chemotherapy response-sensitive group.

