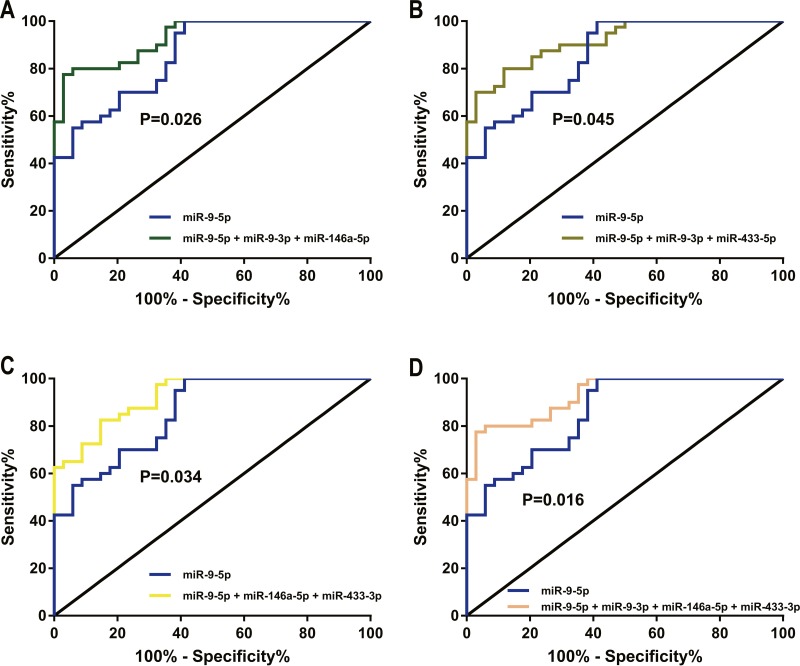
Figure 8. Pairwise comparison of ROC curves by the MedCalc software.
(A) The two compared areas between the miR-9-5p + miR-9-3p + miR-146a-5p group and the miR-9-5p group were significantly different. (B)The two compared areas between the miR-9-5p + miR-9-3p + miR-433-3p group and the miR-9-5p group were significantly different. (C) The two compared areas between the miR-9-5p + miR-146a-5p + miR-433-3p group and the miR-9-5p group were significantly different. (D) The two compared areas between the miR-9-5p + miR-9-3p + miR-146a-5p + miR-433-3p group and the miR-9-5p group were significantly different.

