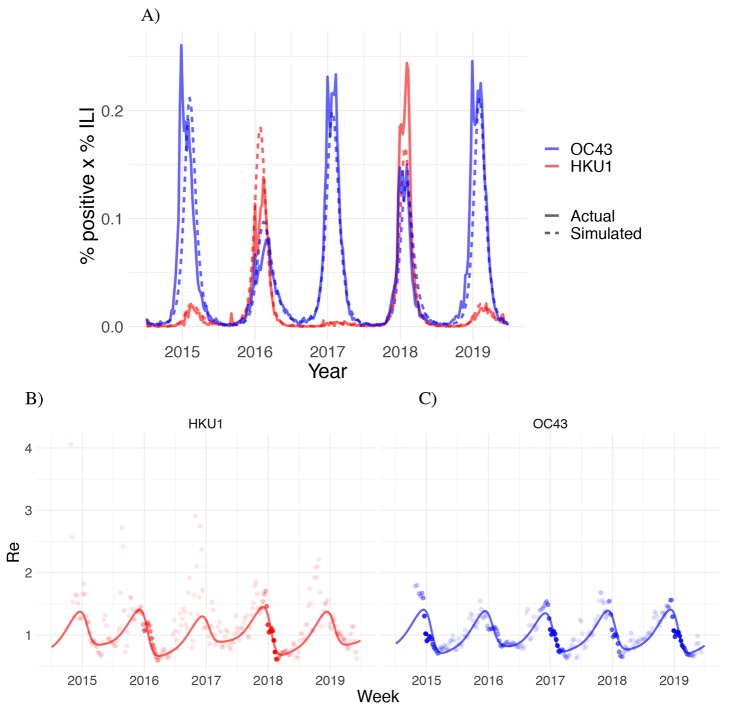
Fig. 2. Transmission model fits for HCoV-OC43 and HCoV-HKU1.
(A) Weekly percent positive laboratory tests multiplied by percent influenza-like illness (ILI) for the human betacoronaviruses HCoV-OC43 (blue) and HCoV-HKU1 (red) in the United States between 5 July 2014 and 29 June 2019 (solid lines) with simulated output from the best-fit SEIRS transmission model (dashed lines). (B and C) Weekly effective reproduction numbers (Re) estimated using the Wallinga-Teunis method (points) and simulated Re from the best-fit SEIRS transmission model (line) for HCoVs OC43 and HKU1. The opacity of each point is determined by the relative percent ILI multiplied by percent positive laboratory tests in that week relative to the maximum percent ILI multiplied by percent positive laboratory tests for that strain across the study period, which reflects uncertainty in the Re estimate; estimates are more certain (darker points) in weeks with higher incidence.

