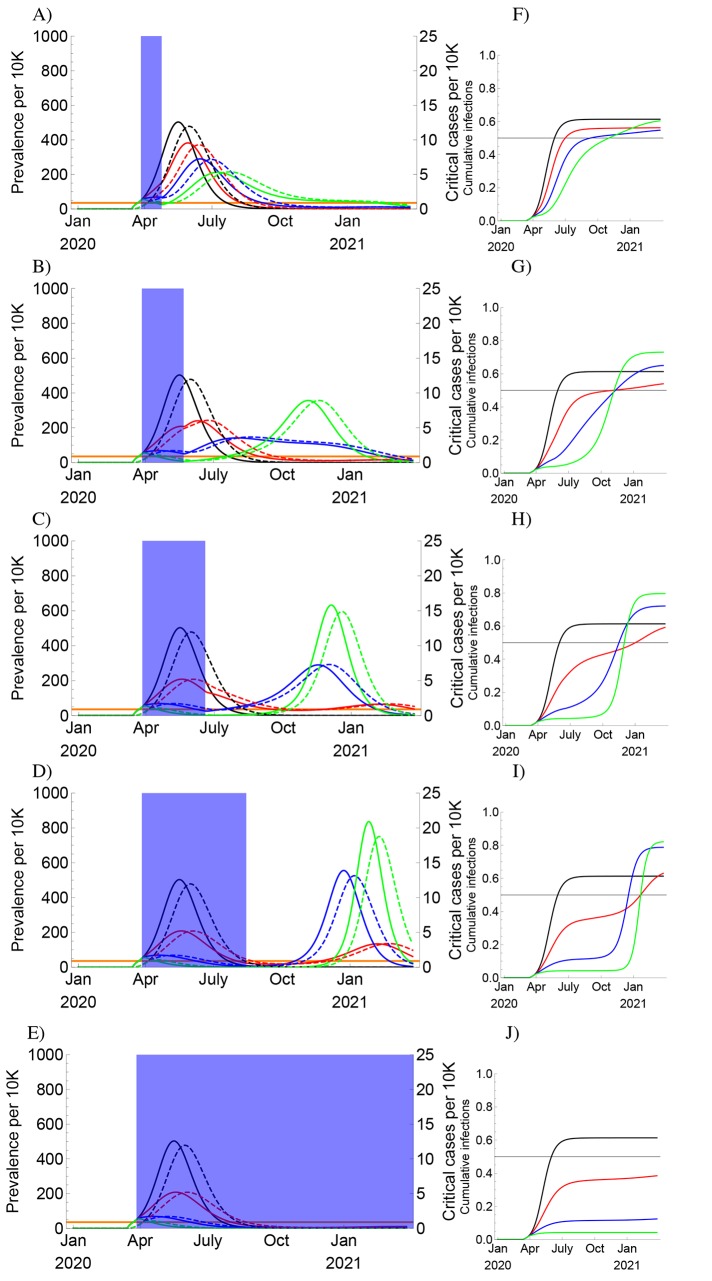
Fig. 5. One-time social distancing scenarios with seasonal transmission.
(A to E) Simulated prevalence, assuming strong seasonal forcing (wintertime R0 = 2.2, summertime R0 = 1.3, or 40% decline), of COVID-19 infections (solid) and critical COVID-19 cases (dashed) following establishment on 11 March 2020 with a period of social distancing (shaded blue region) instated two weeks later, with the duration of social distancing lasting (A) four weeks, (B) eight weeks, (C) twelve weeks, (D) twenty weeks, and (E) indefinitely (see fig. S13 for a scenario with wintertime R0 = 2.6). The effectiveness of social distancing varied from none to a 60% reduction in R0. Cumulative infection sizes are depicted beside each prevalence plot (F to J) with the herd immunity threshold (horizontal black bar). Preventing widespread infection during the summer can flatten and prolong the epidemic but can also lead to a high density of susceptible individuals who could become infected in an intense autumn wave.

