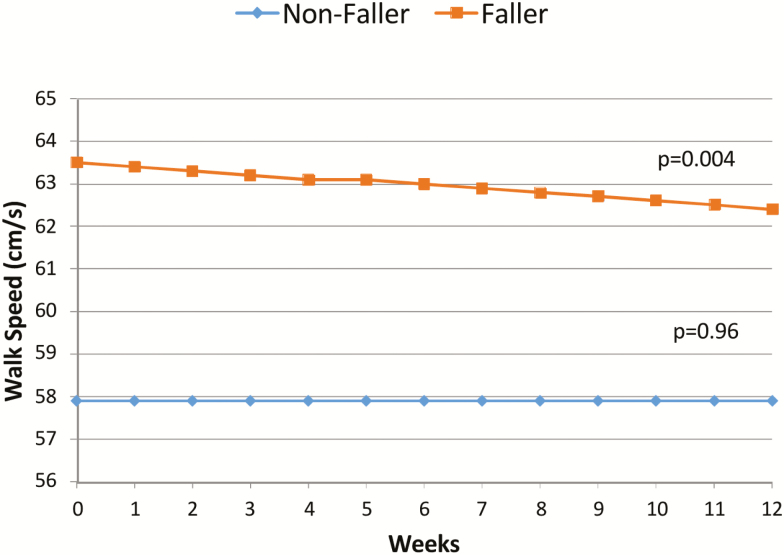
Figure 1.
Longitudinal decline in walking speed before a fall versus controls. The figure presents those destined to fall versus controls longitudinal walking speeds during the 3 months periods. As controls’ walking speed do not change over time, those who will fall experience a decline in walking speed of 0.1 cm s−1 every week. Calculated regression lines are from the mixed-effect model results.

