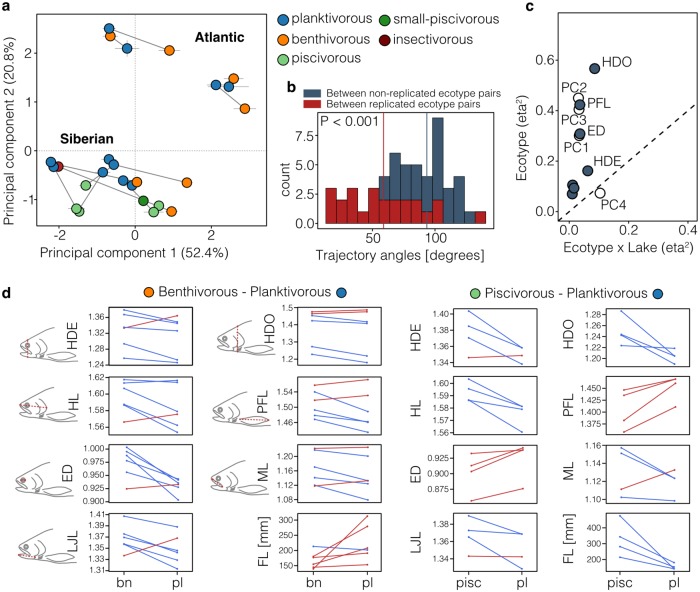
Fig 2. Continuum of phenotypic parallelism.
(A) Principal components plot based on all seven linear traits showing the centroid ± s.e. for each ecotype (N = 1,329 individuals), with centroids of sympatric ecotypes connected by trajectories. Points are coloured by ecotype: bn–benthivorous, pl–planktivorous, pisc–piscivorous, pisc-s–small-piscivorous, insct–insectivorous. (B) Phenotypic trajectory angles between replicated ecotype pairs and between non-replicated ecotype pairs, with mean angles highlighted by dashed lines. Angles between replicated ecotype pairs were significantly smaller compared to non-replicated ecotype pairs (Wilcoxon test: P < 0.001) (C) Effect sizes (partial η2) of the ecotype and ‘ecotype x lake’ interaction terms for all seven linear traits (dark dots) and PC1 to PC4 (white dots). Traits above the dashed diagonal line show stronger parallel than non-parallel divergence across ecotype pairs. (D) Mean size-adjusted trait-values and mean fork length (in mm) are plotted for each benthivorous-planktivorous and piscivorous-planktivorous ecotype pair, with means for sympatric pair being connected by a line. These reaction norms are colour coded blue and red highlighting the decrease or increase of trait values, respectively, between benthivorous (bn) or piscivorous (pisc) and planktivorous (pl) ecotypes. The measured traits are illustrated next to each plot for the benthivorous-planktivorous pairs. See text, panel 1C and S1 Fig for details on statistical results.

