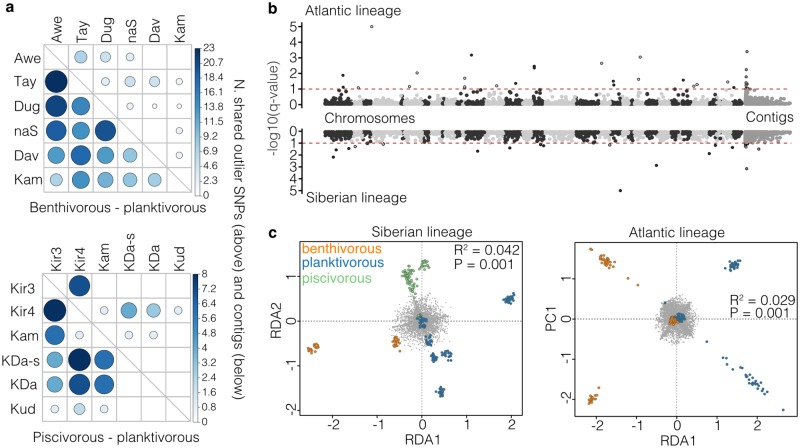
Fig 5. Non-parallelism in genetic differentiation and ecotype-association.
(A) Sharing of outlier SNPs and contigs containing outlier SNPs across replicated benthivorous-planktivorous and piscivorous-planktivorous ecotype pairs. The colour and size of the dots illustrates the number of shared SNPs or contigs. None of the pairwise comparisons are significant based on permutation results (see Methods). (B) Manhattan plots showing the results of the hierarchical bayescan analysis. SNPs with -log10(q-values) above 1 (FDR < 0.1) show significant signs of parallel selection across ecotype pairs by lineage. The upper plot shows the results for benthivorous-planktivorous ecotype pairs in the Atlantic lineage, and the lower plot shows the results for piscivorous-planktivorous ecotype pairs in the Siberian lineage. Results for the benthivorous-planktivorous ecotype pairs from the Siberian lineage are shown in S10 Fig. Unplaced contigs are placed at the right end of the Manhattan plot. (C) Results of the redundancy analysis (RDA) for the Atlantic and Siberian lineages, showing varying levels of separation between ecotypes, coded by colour. The RDA significantly separates ecotypes after correcting for the effect of lake (results of ANOVA shown in plot). Grey dots show the loadings for individual SNPs. RDA1 is plotted against PC1 in the Atlantic lineage, as no second RDA is present based on the bimodal nature of the comparison. RDA1 also separated benthivorous and planktivorous ecotypes across lakes in the Siberian lineage, and RDA2 separated the piscivorous ecotype from both other ecotypes.

