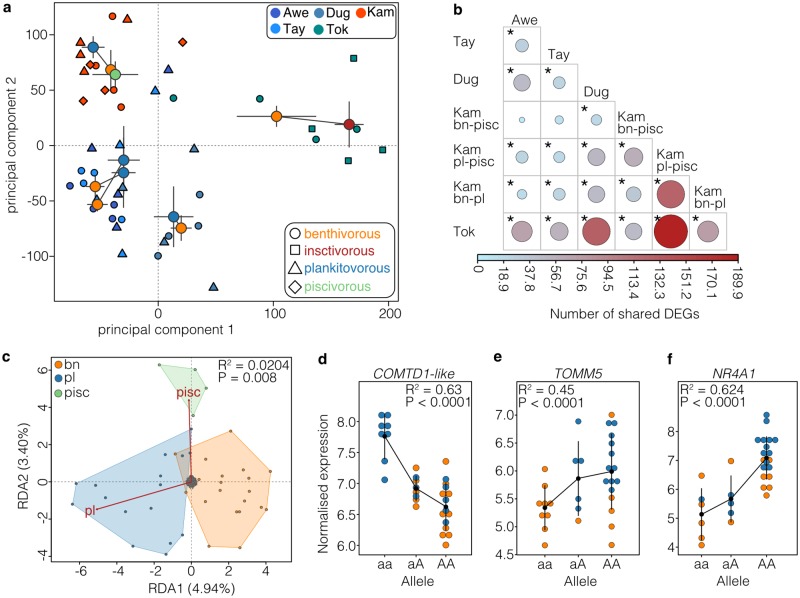
Fig 6. Parallelism and divergence in gene expression.
(A) Principal components plot based on r-log transformed gene expression data (N = 30,849 transcripts). Individuals (N = 44) are shown by individual points shaped by ecotype and coloured by lake of origin. Centroids ± 1 standard error are shown for each ecotype and coloured by ecotype (blue–planktivorous, orange–benthivorous, green–piscivorous, red–insectivorous). Centroids of sympatric ecotypes are connected by a line. (B) Sharing of differentially expressed genes with the extent of sharing weighted by colour and circle size. Significant comparisons are highlighted with an asterisk. Ecotype abbreviations: bn–benthivorous, pl–planktivorous, pisc–piscivorous. (C) Biplot of the gene expression-based redundancy analysis showing significant separation of ecotypes after correction for lake and lineage, with benthivorous (orange area) and planktivorous (blue area) separating along RDA1 (4.94%) and the piscivorous (green area) splitting off along RDA2 (3.40%). (D-F) Examples of cis-eQTL in (D) COMTD1-like, (E) TOMM5 and (F) NR4A1, showing how the expression of these ecotype-associated genes differs with genotype across individuals (points) and ecotypes. The black dot and range show the mean expression per allele ± 1 standard deviation. The R2 value shows the strength of correlation between allele and normalised expression.

