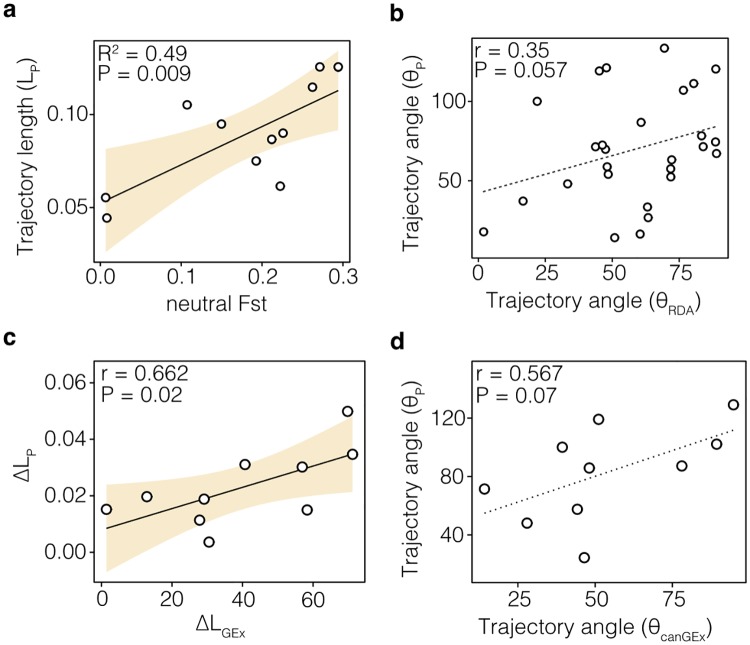
Fig 7. Correlation of gene expression and genetic variation with phenotypic divergence.
(A) Significant correlation between the degree of neutral genetic differentiation (neutral Fst) and phenotypic divergence (LP), with the shaded area highlighting the 95th confidence interval (CI) (N = 11). (B) The direction of allele frequency change of ecotype-associated loci (θRDA) showed a weak correlation with the direction of phenotypic change (θP) across ecotype pairs (N = 27). The dotted regression line shows the weak but non-significant correlation. (C) Differences in the magnitude of phenotypic divergence (ΔLP) are significantly correlated with differences in the magnitude of gene expression divergence (ΔLGEx) between sympatric Arctic charr ecotypes (N = 10). (D) The direction of expression trajectories of ecotype-associated genes (θcanGEx) tends explain the direction of the phenotypic trajectories (θP) (N = 10). Each panel shows the linear model or Mantel test result.

