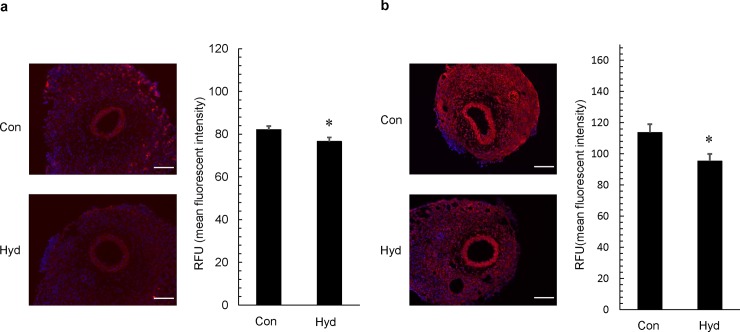
Fig 6. Effect of hydrogen gas on DNA damage by ROS.
Tissue samples were prepared from cuffed arteries 7 days after operation. (A) Representative photos of cross-sections of injured femoral artery after immunohistochemical staining with anti-nitroguanidine antibody and fluorescence intensity in intima and media. The original photos were obtained as 8-bit images (original magnification ×200; scale bar: 100 μm), and data represent relative fluorescence units (RFU). Values are mean ±SEM (n = 21 for air group (Con), n = 21 for hydrogen group (Hyd)). *p<0.05 vs. Con.

