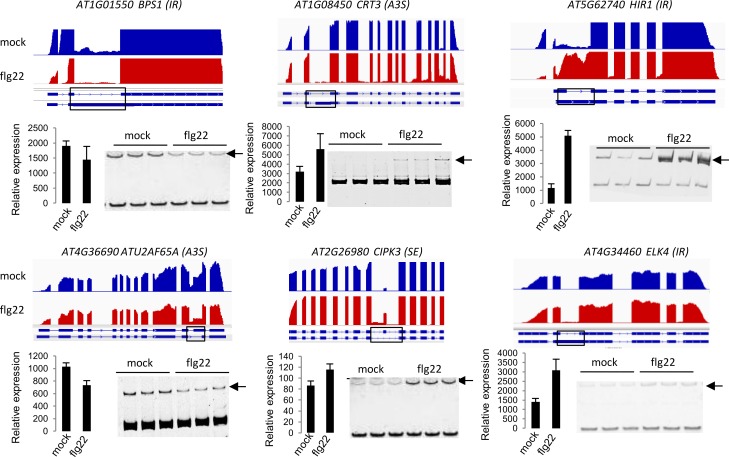
Fig 2. RT-PCR analysis of selected differential splicing events in response to flg22.
Normalized RNA-seq coverage data are shown in the upper part of each panel. Scale is the same in each track. Relative expression for each gene was calculated based on the normalized RNA-seq read count produced by DEseq2. A black arrow marks the position of the alternative isoform. RT-PCR was performed on 3 biological replicates.

