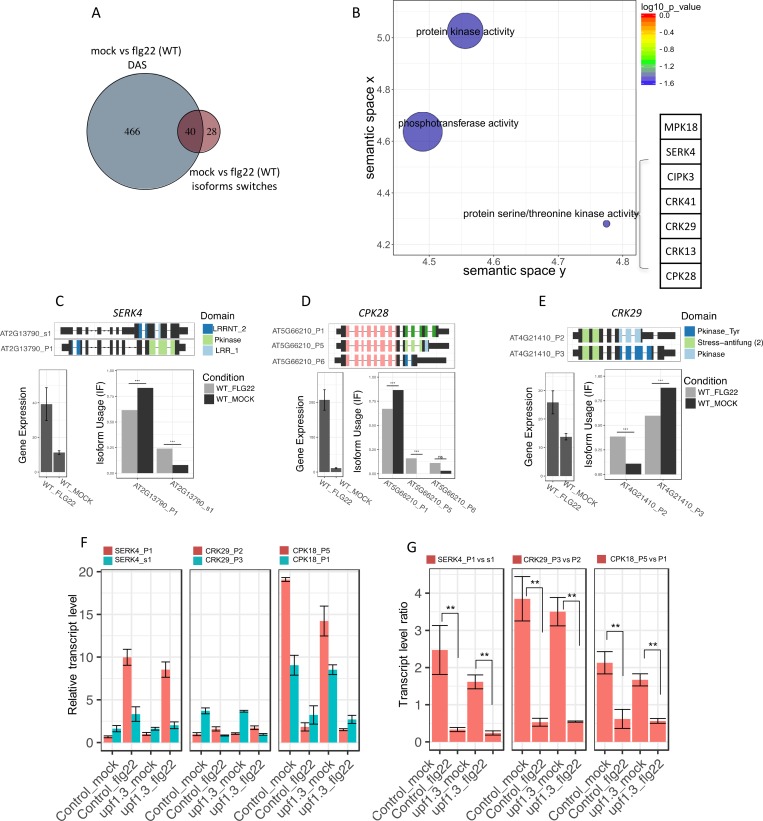
Fig 6. Flg22-induces protein kinase isoform switching.
A, Venn comparison plot between DAS genes compared to genes with isoform switching events in response to flg22 in WT. B, REVIGO plots of gene ontology enrichment clusters of DAS genes both in mpk4 compared to wild type and in response to flg22 in wild-type plants. Each circle represents a significant GO category but only groups of highest significance are labeled. Related GOs have similar (x, y) coordinates. C-D-E, Results of IsoformSwitchAnalysisR showing the gene diagram of differential isoforms with the predicted PFAM domain, change in gene expression and relative isoform abundance in response to flg22 and isoform-specific RT-qPCR analysis showing F, the relative transcript abundance (normalized against the housekeeping gene AT4G26410) and G ratio of isoform abundances in response to mock or flg22 treatment in WT and upf1upf3 for SERK4, CPK28 and CRK29. Significant differences were estimated by student t-test (** p-value < 0.01).

