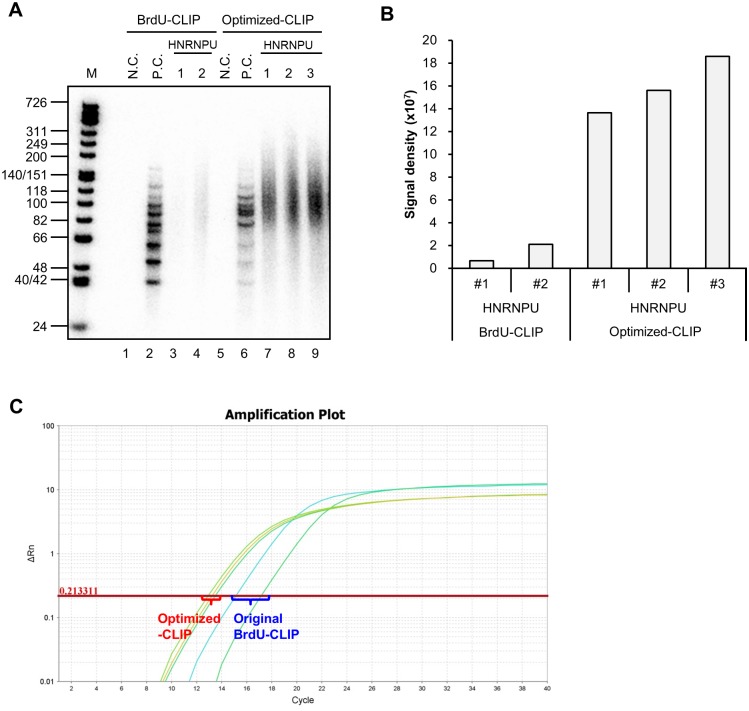
Fig 3. Comparison of BrdU-CLIP and optimized CLIP.
Before PCR amplification, radiolabeled CLIP cDNA libraries were separated by 10% TBE-urea PAGE (A), and signal intensities were quantified (B). Signal intensities were measured between 66 and 200 nt; Averaged HNRNPU CLIP library signal intensities for optimized CLIP and BrdU-CLIP were 1.59 x 10⁸ and 1.38 x 10⁷, respectively. (C) Plot of CLIP library amplification PCR. Average Ct values for optimized CLIP and BrdU-CLIP were 13.2 and 16.2, respectively.

