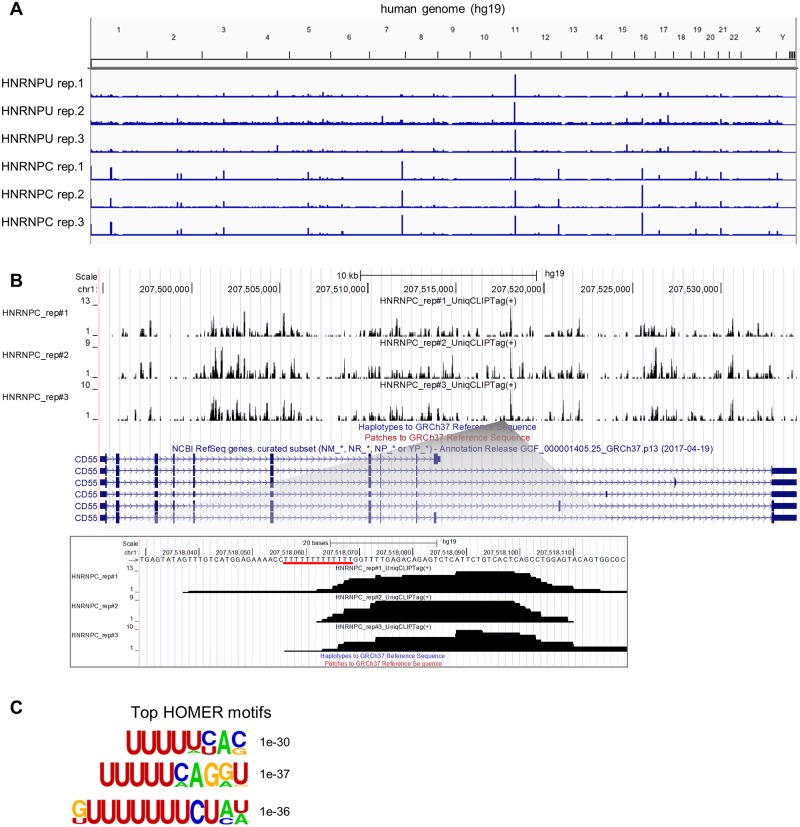
Fig 4. Optimized CLIP feasibility study.
(A) Optimized CLIP-tag distribution across the human genome (hg19). HNRNPU and HNRNPC Optimized CLIP were performed using whole lysates from HeLa cells. CLIP-tags were visualized using the Integrative Genomics Viewer (IGV). (B) HNRNPC tag distribution at the CD55 locus visualized using the UCSC Genome Browser, which was validated as a HNRNPC target by iCLIP and irCLIP. The highest peak at the CD55 locus is enlarged, and the poly-U tract is underscored in red. (C) Motif analysis for CITS sites of HNRNPC CLIP. CITS sites were extracted around -9 and +9 nt of peak ends and analyzed by HOMER; motif lengths are 8, 10, and 12 nt.

