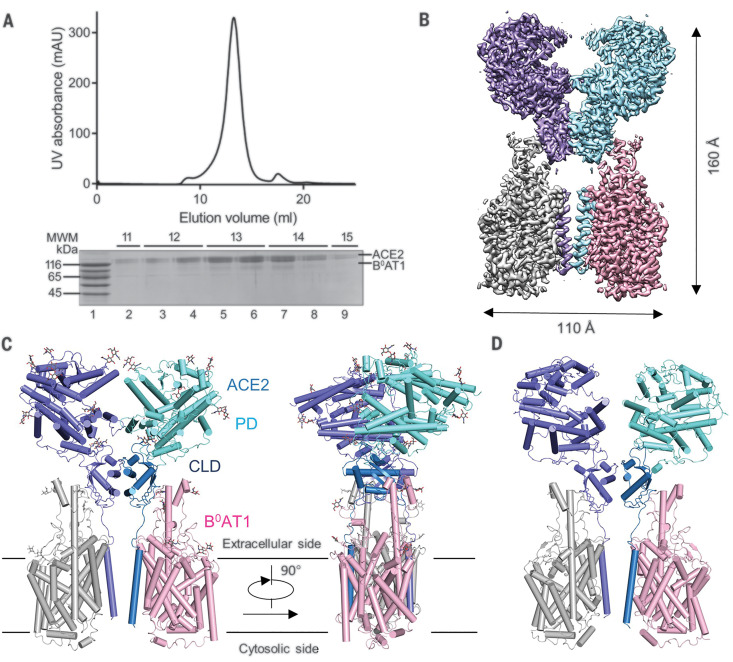
Fig. 1. Overall structure of the ACE2-B0AT1 complex.
(A) Representative size exclusion chromatography purification profile of full-length human ACE2 in complex with B0AT1. UV, ultraviolet; mAU, milli–absorbance units; MWM, molecular weight marker. (B) Cryo-EM map of the ACE2-B0AT1 complex. The map is generated by merging the focused refined maps shown in fig. S2. Protomer A of ACE2 (cyan), protomer B of ACE2 (blue), protomer A of B0AT1 (pink) and protomer B of B0AT1 (gray) are shown. (C) Cartoon representation of the atomic model of the ACE2-B0AT1 complex. The glycosylation moieties are shown as sticks. The complex is colored by subunits, with the PD and CLD in one ACE2 protomer colored cyan and blue, respectively. (D) An open conformation of the ACE2-B0AT1 complex. The two PDs, which contact each other in the closed conformation, are separated in the open conformation.

