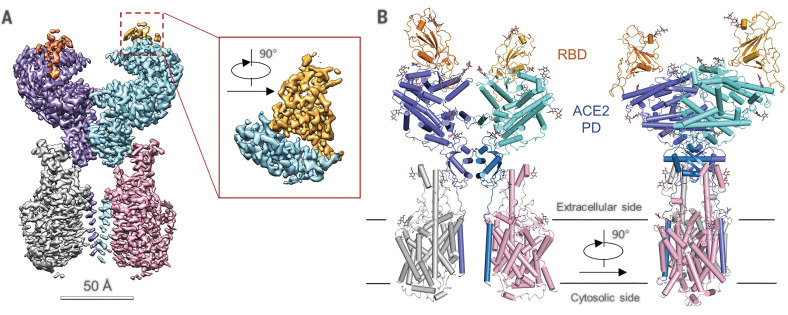
Fig. 3. Overall structure of the RBD-ACE2-B0AT1 complex.
(A) Cryo-EM map of the RBD-ACE2-B0AT1 complex. The overall reconstruction of the ternary complex at 2.9 Å is shown on the left. The inset shows the focused refined map of RBD. The color scheme is the same as that in Fig. 1B, with the addition of red and gold, which represent RBD protomers. (B) Overall structure of the RBD-ACE2-B0AT1 complex. The color scheme is the same as that in Fig. 1C. The glycosylation moieties are shown as sticks.

