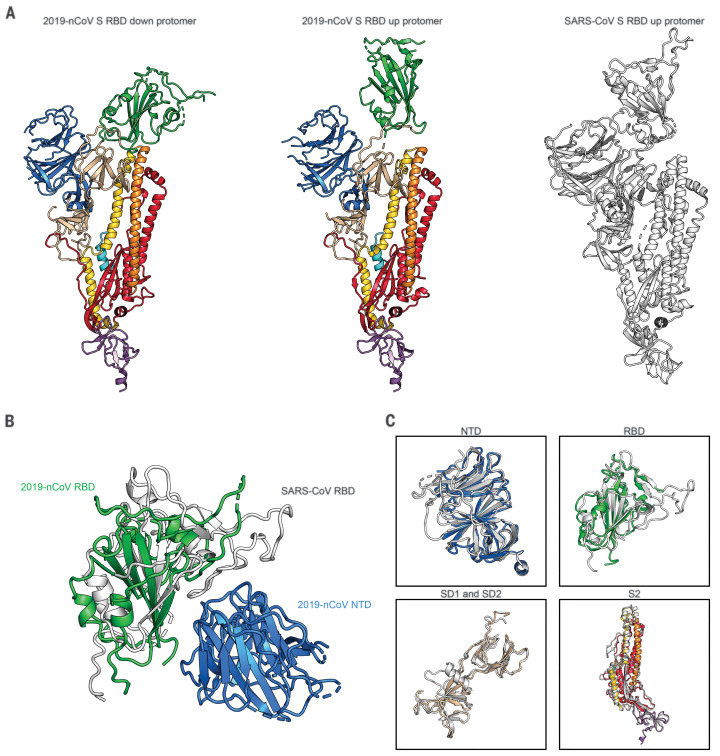
Fig. 2. Structural comparison between 2019-nCoV S and SARS-CoV S.
(A) Single protomer of 2019-nCoV S with the RBD in the down conformation (left) is shown in ribbons colored according to Fig. 1. A protomer of 2019-nCoV S in the RBD up conformation is shown (center) next to a protomer of SARS-CoV S in the RBD up conformation (right), displayed as ribbons and colored white (PDB ID: 6CRZ). (B) RBDs of 2019-nCoV and SARS-CoV aligned based on the position of the adjacent NTD from the neighboring protomer. The 2019-nCoV RBD is colored green and the SARS-CoV RBD is colored white. The 2019-nCoV NTD is colored blue. (C) Structural domains from 2019-nCoV S have been aligned to their counterparts from SARS-CoV S as follows: NTD (top left), RBD (top right), SD1 and SD2 (bottom left), and S2 (bottom right).

