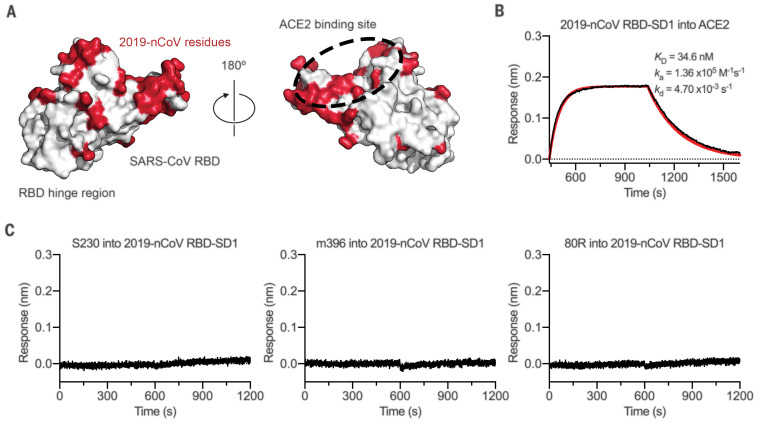
Fig. 4. Antigenicity of the 2019-nCoV RBD.
(A) SARS-CoV RBD shown as a white molecular surface (PDB ID: 2AJF), with residues that vary in the 2019-nCoV RBD colored red. The ACE2-binding site is outlined with a black dashed line. (B) Biolayer interferometry sensorgram showing binding to ACE2 by the 2019-nCoV RBD-SD1. Binding data are shown as a black line, and the best fit of the data to a 1:1 binding model is shown in red. (C) Biolayer interferometry to measure cross-reactivity of the SARS-CoV RBD-directed antibodies S230, m396, and 80R. Sensor tips with immobilized antibodies were dipped into wells containing 2019-nCoV RBD-SD1, and the resulting data are shown as a black line.

