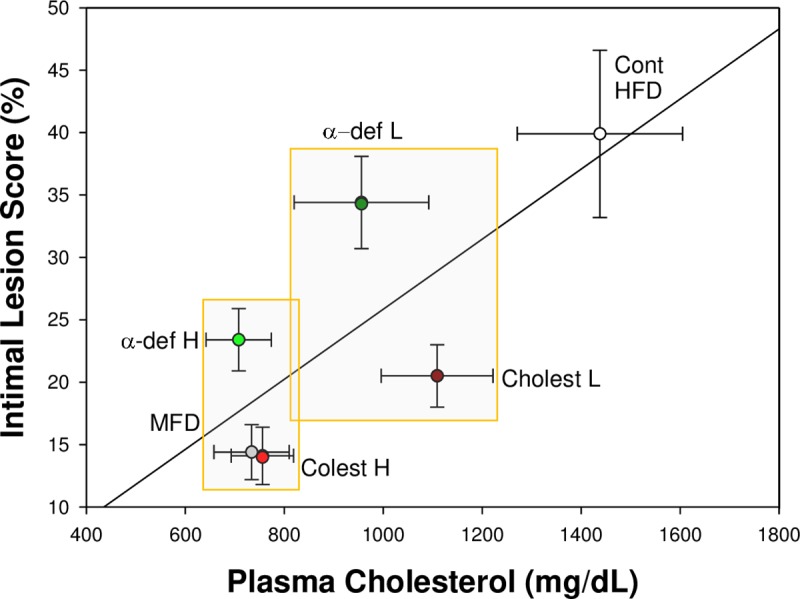
Fig 2. Correlation between plasma cholesterol and size of lipid-rich streaks in aortic roots.

Data from the six groups of ApoE−/− mice described in Fig 1, panels A and B are compared (regression line), and separately for each experimental group (mean ± SD, n = 16 per group). A highly significant correlation is noted in between plasma cholesterol and lesion size, plotted for the entire cohort of mice (R = 0.7, p<0.0001, Pearson's correlation). The two rectangles illustrate experimental groups with comparable plasma cholesterol but significantly higher lesion size score in the α-def-1 groups (p<0.001, ANOVA).
