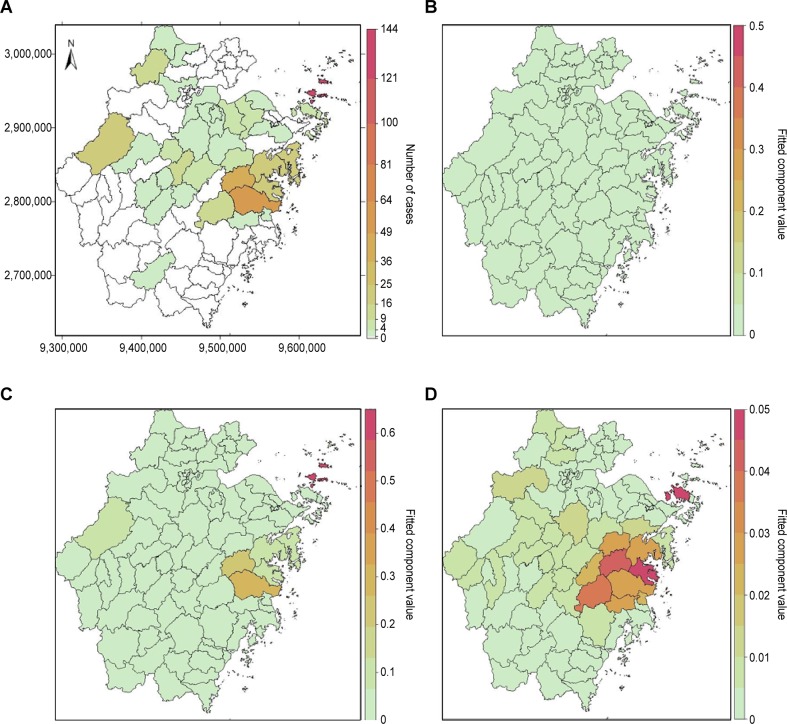
Fig 3. The district-specific total incidence and fitted component of SFTS in Zhejiang Province, China, 2011–2018.
These maps were created by R software (version 3.3.1, http://www.r-project.org/). (A) The total incidence of SFTS from 2011 to 2018. (B) The endemic component at the county level. (C) The autoregressive component at the county level. (D) The spatiotemporal component at the county level.

