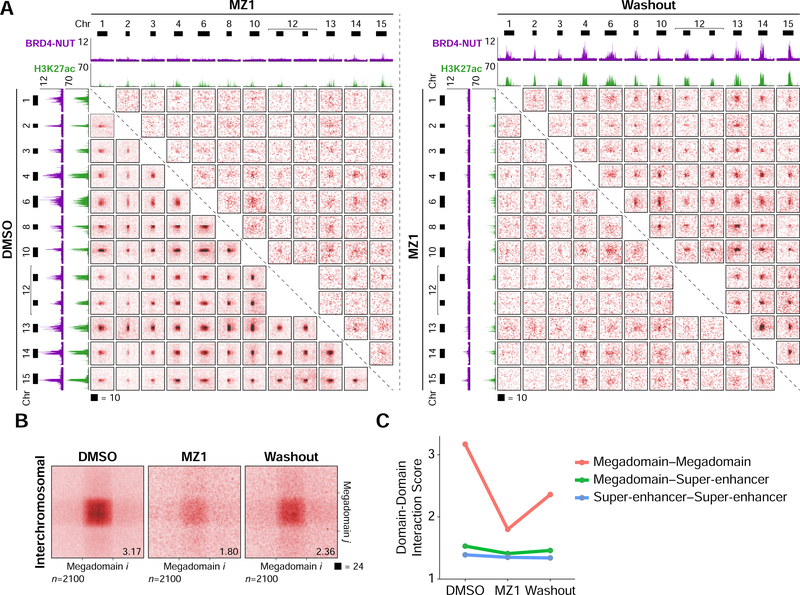
Figure 3. Interchromosomal Interactions Between Acetylated Loci.
(A) Hi-C contact maps at 100 kb resolution from TC-797 cells demonstrating interchromosomal interactions between twelve example megadomains. Interactions between all pairs of megadomains were reduced after MZ1 treatment and partially recovered after drug washout. Each contact map is a 2 × 2 Mb region centered on a single megadomain. BRD4-NUT (magenta) and histone H3K27ac (green) ChIP-seq profiles are aligned with the maps. Black bars indicate megadomains in DMSO treated cells.
(B) Interchromosomal, genome-wide aggregate analysis of megadomain-megadomain interactions from TC-797 cells treated with DMSO, MZ1, or MZ1 followed by drug washout demonstrating genome-wide reduction in interchromosomal megadomain-megadomain interactions after MZ1 treatment that partially recovered after drug washout. Regions around each megadomain-megadomain interaction were extracted from 5 kb resolution Hi-C contact maps, normalized to the same size, and the resulting submatrices then averaged. Domain-domain interaction scores are given at bottom right.
(C) Domain-domain interaction scores for interchromosomal megadomain-megadomain (red), megadomain-super-enhancer (green), and super-enhancer-super-enhancer interactions. Unlike megadomain-megadomain interactions, super-enhancer-super-enhancer interactions are not sensitive to MZ1.

