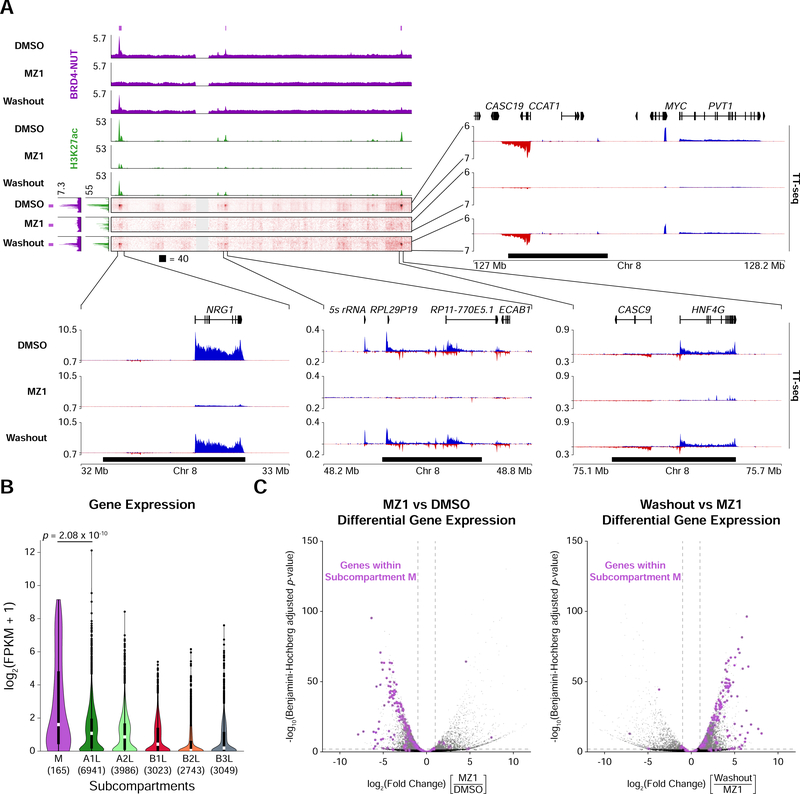
Figure 6. Elevated Gene Expression in the Megadomain-Specific Subcompartment.
(A) Off-diagonal slices of Hi-C contact maps at 100 kb resolution from TC-797 cells treated with DMSO, MZ1, or MZ1 followed by drug washout. BRD4-NUT (magenta) and histone H3K27ac (green) ChIP-seq profiles are aligned with the maps. Purple bars indicate subcompartment M intervals and black bars indicate megadomains in DMSO treated cells. Zoomed areas show nascent transcription profiles analyzed by TT-seq (sense transcripts in blue, anti-sense transcripts in red).
(B) Violin plots overlaid with Tukey box plots (white bars show medians; boxes indicate interquartile range; whiskers extend 1.5 times the interquartile range; black dots are outliers) indicating that expression levels for genes within subcompartment M are greater than that for genes in the other subcompartments. Value in parenthesis indicate the number of genes in each subcompartment. p-value is from one-sided Mann-Whitney U tests.
(C) Volcano plots (significance versus fold change) of differentially expressed genes show that after MZ1 treatment genes within subcompartment M (purple dots) are downregulated (left) whereas after drug washout genes within subcompartment M (purple dots) are upregulated (right) in TC-797 cells. Horizontal dashed line indicates a Benjamini-Hochberg adjusted p-value of 0.01; vertical dashed lines indicate 2-fold change in expression.

